










Finbud Financial Services Limited H1 profit drops 47%
Key highlights
- Finbud’s total revenue rose 38% to Rs 192.1554 crore in the half year ended September 30, 2026.
- Finbud’s consolidated profit after tax fell 47% to Rs 2.705 crore from Rs 5.1201 crore a year earlier.
- Finbud reported an operating cash outflow of Rs 28.7702 crore, including Rs 20.4239 crore absorbed by trade receivables.
- Finbud’s cash and cash equivalents declined to Rs 56.4757 crore at September 30, 2026 from Rs 70.076 crore at March 31, 2026.
powered by IRIS
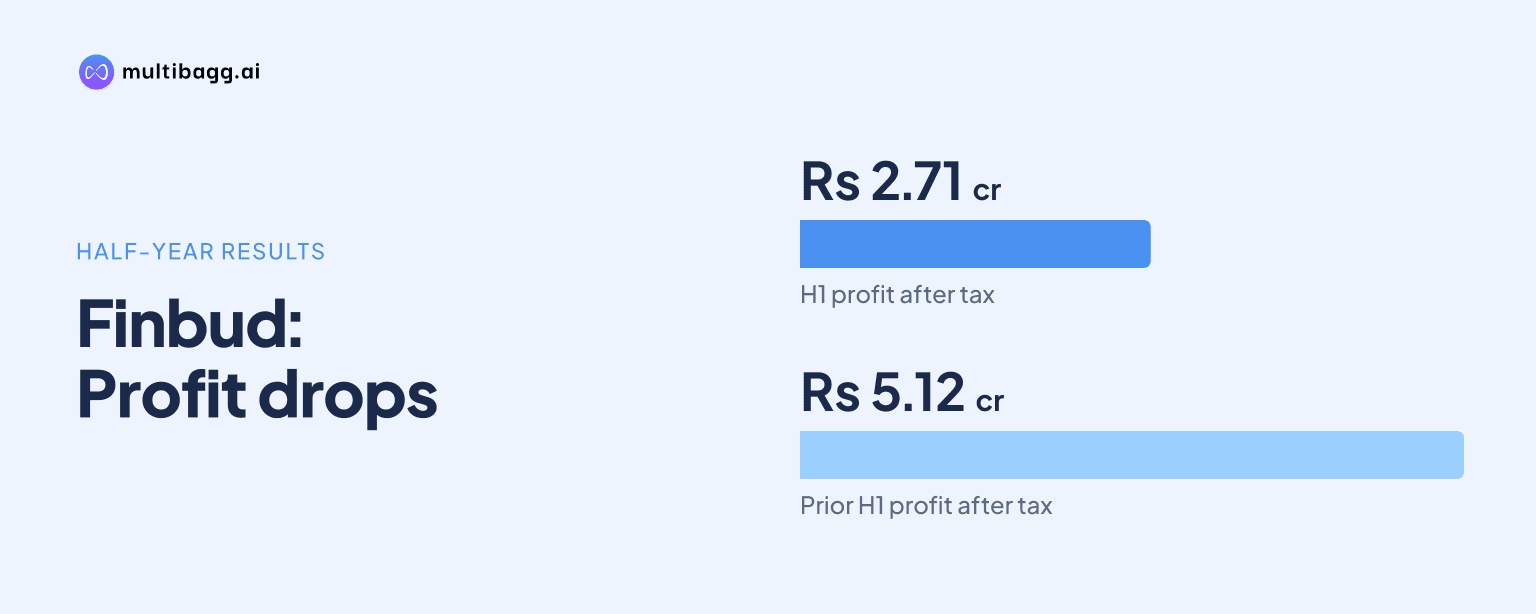
Finbud Financial Services Limited reported consolidated profit after tax of Rs 2.705 crore for the half year ended September 30, 2026, down 47% from Rs 5.1201 crore a year earlier, despite total revenue rising 38% to Rs 192.1554 crore. Total expenses increased 43% to Rs 188.5089 crore, narrowing profit before tax to Rs 3.6465 crore.
Know Finbud Financial Services inside out
Results, valuation, peers and who's buying, in one view.
Why did Finbud’s H1 profit fall despite higher revenue?
Finbud’s H1 profit fell because expense growth exceeded revenue growth in the half year ended September 30, 2026. Total revenue increased by Rs 53.0171 crore from Rs 139.1383 crore in the corresponding half year of 2025, while total expenses rose by Rs 56.4966 crore from Rs 132.0123 crore. As a result, profit before tax declined by Rs 3.4795 crore to Rs 3.6465 crore.
Profit after tax fell to Rs 2.705 crore from Rs 5.1201 crore, while basic and diluted earnings per share both declined to Rs 1.42 from Rs 3.66. Revenue from operations rose to Rs 191.1085 crore from Rs 138.9843 crore, and other income increased to Rs 1.0469 crore from Rs 0.154 crore. The higher operating revenue therefore did not offset the larger increase in costs.
Finbud also recorded lower profit than in the immediately preceding half year ended March 31, 2026, when profit after tax was Rs 6.5255 crore on total revenue of Rs 178.7413 crore. The filing identifies the March 2026 half-year numbers as balancing figures between audited full-year results and year-to-date figures for that financial year.
How did Finbud’s expenses change in H1?
Finbud’s employee-benefit and other expenses drove the increase in costs during the September 2026 half year. Employee-benefit expense rose 71% to Rs 23.3511 crore from Rs 13.6888 crore, while other expenses increased 40% to Rs 162.529 crore from Rs 116.2003 crore. These two expense lines together accounted for Rs 55.991 crore of the Rs 56.4966 crore total-expense increase.
Finance costs increased to Rs 1.2952 crore from Rs 1.1023 crore, and depreciation and amortisation rose to Rs 1.3336 crore from Rs 1.0209 crore. Tax expense declined to Rs 0.9415 crore from Rs 2.0059 crore, partly moderating the fall in post-tax profit. The latest tax charge included a deferred-tax credit of Rs 0.8571 crore, compared with a Rs 0.0117 crore deferred-tax credit a year earlier.
The statutory results provide no separate profit disclosure by operation because Finbud states that it operates in one business segment and one geographical area under Accounting Standard 17. The consolidated limited review covers Finbud, subsidiary LTCV Credit Private Limited and wholly owned subsidiary ZAP Private Limited for the half year ended September 30, 2026.
What happened to Finbud’s receivables and operating cash flow?
Finbud reported net cash used in operating activities of Rs 28.7702 crore for the period ended September 30, 2026, compared with an outflow of Rs 12.7137 crore for the year ended March 31, 2026. Operating profit before working-capital changes was Rs 5.3279 crore, but trade receivables absorbed Rs 20.4239 crore and loans and advances absorbed Rs 12.8675 crore.
Cash used in operations reached Rs 26.9716 crore before net tax paid of Rs 1.7986 crore. Trade payables reduced cash by Rs 4.4909 crore, while other current liabilities added Rs 1.718 crore. The filing does not provide a receivables ageing schedule or a detailed explanation of the movement in loans and advances.
Trade receivables increased to Rs 64.7867 crore at September 30, 2026 from Rs 44.3628 crore at March 31, 2026. Short-term loans and advances rose to Rs 43.8039 crore from Rs 30.7503 crore over the same period. Cash and cash equivalents consequently declined by Rs 13.6003 crore to Rs 56.4757 crore from Rs 70.076 crore.
Got a follow-up? Ask IRIS
How did financing and the balance sheet change?
Finbud generated Rs 16.8439 crore from financing activities in the period ended September 30, 2026, partly offsetting operating and investing cash outflows. Financing inflows included Rs 10.8558 crore from issue of preference share capital to minority interest, Rs 5.9594 crore of short-term borrowing proceeds and Rs 1 crore of share application money received. Interest paid was Rs 1.2952 crore.
Short-term borrowings stood at Rs 28.9735 crore at September 30, 2026, compared with Rs 23.0141 crore at March 31, 2026. Long-term borrowings fell from Rs 0.2129 crore to nil after repayment. Total assets increased to Rs 183.2961 crore from Rs 167.0099 crore, while property, plant and equipment increased to Rs 5.9927 crore from Rs 4.705 crore.
Investing activities used Rs 1.674 crore, including Rs 2.6214 crore spent on property, plant and equipment, partly offset by Rs 0.9474 crore of interest received. Finbud disclosed that Rs 36.50 lakh of initial public offering proceeds had been utilised by September 2026, including Rs 15.11 lakh for working-capital requirements and Rs 15 lakh for investment in a wholly owned subsidiary.
What do Finbud’s business updates say about ZAP and LTCV?
Finbud’s business update said the Finbud and ZAP loan-aggregation operations generated profit after tax of Rs 5.1 crore in H1FY2026-27, unchanged from H1FY2025-26, on sales of Rs 188.3 crore, up 36%. Management said the statutory consolidated profit of about Rs 2.7 crore included a Rs 2.4 crore loss at LTCV, which it calls Equall in the update.
Management attributed part of the Finbud and ZAP result to Rs 3.2 crore of incremental investment in ZAP’s technology, data-science and leadership functions. ZAP reported sales of Rs 30.3 crore, up 57%, and earnings before interest, tax, depreciation and amortisation of Rs 2.7 crore after those long-term investments. ZAP’s digital-business contribution was 16% of total business sales, compared with 14% a year earlier.
LTCV reported a loan book of Rs 21.4 crore at September 30, 2026 and H1 disbursements of Rs 18.6 crore, comprising Rs 7.4 crore in the first quarter and Rs 11.2 crore in the second quarter. Management said LTCV remained on track for monthly operating breakeven by the end of the fourth quarter of FY2026-27. It also said ZAP plans to diversify marketing channels and expand into new categories after lower customer acquisition in August and September.
Conclusion
Finbud’s September 2026 half-year statement shows that revenue growth did not translate into higher consolidated earnings. Revenue increased 38% to Rs 192.1554 crore, but expenses rose 43% to Rs 188.5089 crore, reducing profit after tax to Rs 2.705 crore. Higher receivables and loans and advances also contributed to an operating cash outflow of Rs 28.7702 crore.
The next disclosed milestone is management’s target for LTCV to reach monthly operating breakeven by the end of Q4 FY2026-27. Management’s plan for ZAP includes marketing-channel diversification and category expansion, while the single-segment statutory disclosure means future consolidated results will remain the principal reported measure of the group’s financial performance.