










Galaxy Surfactants operating cash flow falls 55% in H1FY27
Key highlights
- Galaxy’s consolidated operating cash flow fell to Rs 76.6 crore in H1FY27 from Rs 169.4 crore in H1FY26.
- Galaxy’s H1FY27 consolidated PAT rose 95.7% to Rs 285.7 crore.
- Galaxy’s trade receivables increased by Rs 363 crore to Rs 1,113.4 crore between Mar'26 and Sept'26.
- Galaxy’s inventories increased by Rs 230.5 crore to Rs 1,024.2 crore between Mar'26 and Sept'26.
powered by IRIS
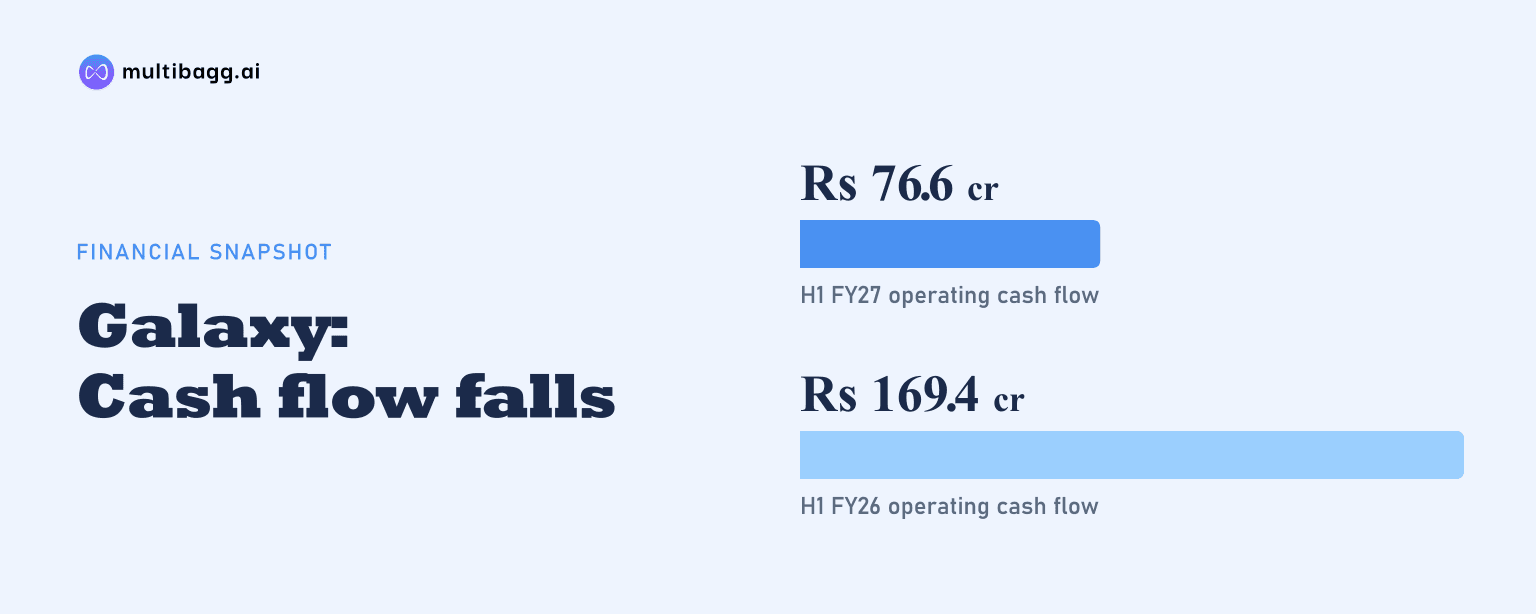
In H1FY27, Galaxy Surfactants’ consolidated operating cash flow fell 54.8% to Rs 76.6 crore from Rs 169.4 crore a year earlier, despite profit after tax nearly doubling to Rs 285.7 crore. The half-year balance sheet showed inventories rising by Rs 230.5 crore and trade receivables by Rs 363 crore from March 2026.
Know Galaxy Surfactants inside out
Results, valuation, peers and who's buying, in one view.
Why did Galaxy’s operating cash flow fall in H1FY27?
Galaxy’s net cash generated from operating activities declined to Rs 76.6 crore in H1FY27 from Rs 169.4 crore in H1FY26, even as operating profit before working-capital changes increased to Rs 442.4 crore from Rs 241 crore. The difference between operating profit before working-capital changes and operating cash flow was Rs 365.8 crore in H1FY27, compared with Rs 71.6 crore in the prior-year half.
Galaxy’s consolidated profit after tax, or PAT, rose to Rs 285.7 crore in H1FY27 from Rs 146 crore in H1FY26. Earnings before interest, tax, depreciation and amortisation, or EBITDA, increased 78.4% to Rs 448.4 crore, and the EBITDA margin expanded to 12.4% from 9.6%.
The presentation reports the lower operating cash flow alongside larger inventory and receivable balances, but it does not provide a line-by-line reconciliation of working-capital movements within the cash-flow statement. It also reports Rs 116.1 crore generated from investing activities in H1FY27, compared with Rs 111.5 crore used in those activities in H1FY26, without a breakdown of the change.
How much did Galaxy’s working-capital balances increase?
Galaxy’s consolidated inventories and trade receivables increased by a combined Rs 593.5 crore between Mar'26 and Sept'26. Inventories rose to Rs 1,024.2 crore from Rs 793.7 crore, while trade receivables reached Rs 1,113.4 crore from Rs 750.4 crore over the six-month period.
Galaxy’s trade payables rose to Rs 856 crore at Sept'26 from Rs 650.9 crore at Mar'26, an increase of Rs 205.1 crore. Across these three selected operating balances, inventories plus receivables less payables increased by Rs 388.4 crore to Rs 1,281.6 crore.
Galaxy’s total current assets increased to Rs 3,049.4 crore at Sept'26 from Rs 2,442.8 crore at Mar'26. Other current assets rose to Rs 153 crore from Rs 142.4 crore, while current investments increased to Rs 481.9 crore from Rs 472.6 crore.
Got a follow-up? Ask IRIS
What drove Galaxy’s higher H1FY27 profit?
Galaxy’s H1FY27 consolidated PAT increased 95.7% year on year to Rs 285.7 crore as total revenue grew 37.4% to Rs 3,602 crore and EBITDA rose 78.4% to Rs 448.4 crore. EBITDA increased faster than revenue, lifting the reported EBITDA margin by 2.8 percentage points to 12.4%.
Net revenue from operations rose to Rs 3,592.3 crore in H1FY27 from Rs 2,604.1 crore in H1FY26. Cost of material consumed increased to Rs 2,572 crore from Rs 1,944 crore, employee benefits expense rose to Rs 204.6 crore from Rs 164 crore, and other expenses increased to Rs 376.9 crore from Rs 261.7 crore.
Galaxy’s revenue mix by category was unchanged across the two half years: Performance Surfactants accounted for 64% of H1FY27 revenue and Specialty Care Products for 36%, matching H1FY26. India represented 44% of revenue in both periods, while AMET accounted for 21% and the rest of the world for 35%.
Depreciation increased to Rs 70.7 crore in H1FY27 from Rs 59.1 crore, while finance cost rose to Rs 19.2 crore from Rs 13.8 crore. Profit before tax after exceptional items nevertheless reached Rs 358.4 crore from Rs 178.4 crore, and tax expense increased to Rs 72.8 crore from Rs 32.4 crore.
How did Galaxy’s cash and funding balances change?
Galaxy’s cash and cash equivalents increased to Rs 265.5 crore at Sept'26 from Rs 109.1 crore at Mar'26. The H1FY27 cash-flow statement records a Rs 155.1 crore net increase in cash and cash equivalents and a Rs 1.3 crore favourable effect from exchange-rate changes, which together reconcile to the Rs 156.4 crore balance-sheet increase.
Galaxy’s bank balances other than cash and cash equivalents fell to Rs 2.6 crore at Sept'26 from Rs 165.8 crore at Mar'26. Current borrowings increased to Rs 179.9 crore from Rs 158.8 crore and non-current borrowings increased to Rs 49.9 crore from Rs 5.7 crore, while financing activities used Rs 37.6 crore in H1FY27.
Conclusion
Galaxy’s H1FY27 accounts show reported profitability rising faster than revenue, with PAT reaching Rs 285.7 crore and EBITDA margin reaching 12.4%, while operating cash generation fell to Rs 76.6 crore. The balance-sheet comparison shows that the increase in inventories and trade receivables exceeded the increase in trade payables between Mar'26 and Sept'26.
The presentation does not disclose a target or timetable for inventory, receivable or operating-cash-flow movements. The unresolved issue for subsequent disclosures is whether Galaxy converts operating profit before working-capital changes of Rs 442.4 crore into higher operating cash flow while its Sept'26 inventory and receivable balances are managed.