










Galaxy Surfactants H1 FY27 PAT exceeds FY26 full-year profit
Key highlights
- Galaxy Surfactants reported H1FY27 PAT of Rs 285.7 crore, above FY26 full-year PAT of Rs 267.4 crore.
- H1FY27 total revenue increased 37.4% year on year to Rs 3,602 crore.
- H1FY27 EBITDA rose 78.4% to Rs 448.4 crore and EBITDA margin reached 12.4%.
- Galaxy Surfactants approved an interim dividend of Rs 18 per share.
powered by IRIS
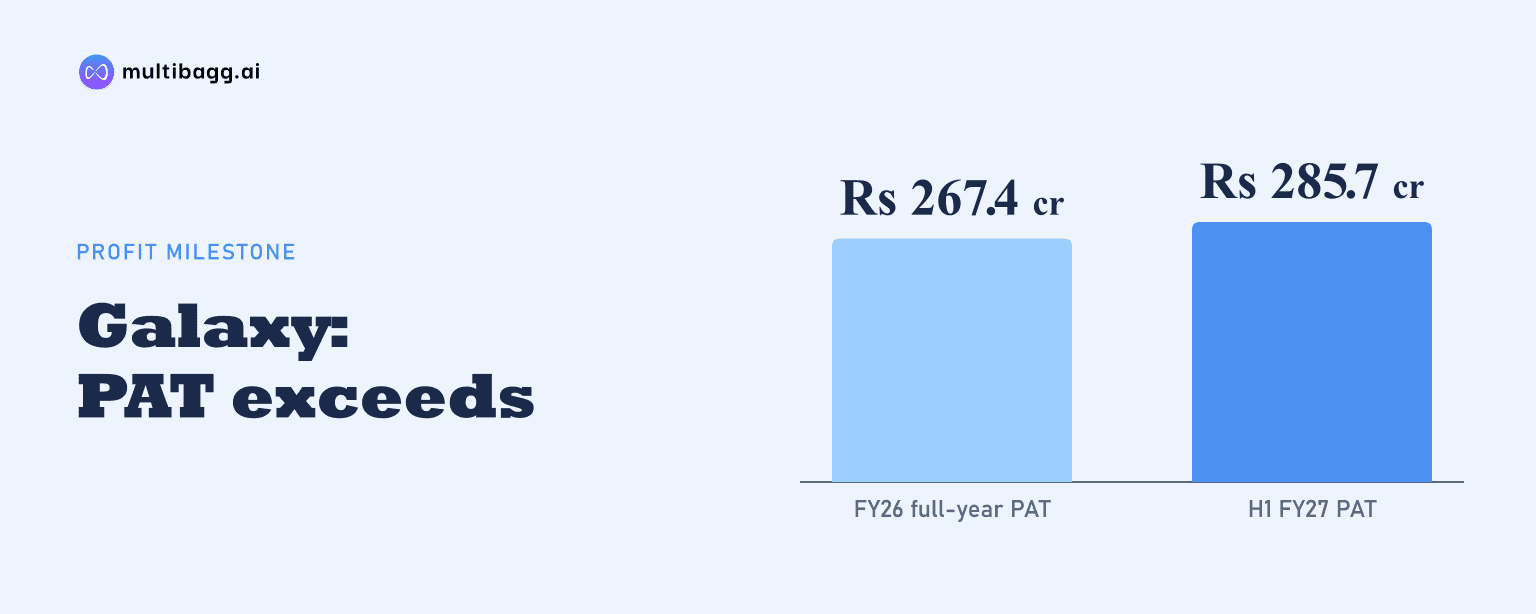
Galaxy Surfactants Limited reported consolidated PAT of Rs 285.7 crore in H1FY27, exceeding its FY26 full-year PAT of Rs 267.4 crore by Rs 18.3 crore. The result followed a 37.4% year-on-year increase in H1FY27 total revenue to Rs 3,602 crore and a 78.4% rise in EBITDA to Rs 448.4 crore.
Know Galaxy Surfactants inside out
Results, valuation, peers and who's buying, in one view.
How did Galaxy Surfactants exceed FY26 profit in six months?
Galaxy Surfactants exceeded its FY26 profit in H1FY27 as PAT rose 95.7% year on year from Rs 146 crore to Rs 285.7 crore, above the Rs 267.4 crore reported for all of FY26. Managing Director K. Natarajan described the first-half result as a significant milestone in the Q2 and H1FY27 management commentary.
The second quarter also recorded higher earnings. Q2FY27 PAT increased 80.1% to Rs 119.8 crore from Rs 66.5 crore in Q2FY26, while total revenue rose 36.4% to Rs 1,816.8 crore. EBITDA, or earnings before interest, tax, depreciation and amortisation, increased 68.4% to Rs 195.9 crore during the quarter.
The comparison shows EBITDA of Rs 448.4 crore in the first half was approaching FY26 EBITDA of Rs 497.4 crore, while PAT had already moved above the prior full-year figure. H1FY27 EBITDA margin increased to 12.4% from 9.6% in H1FY26, and Q2FY27 EBITDA margin rose to 10.8% from 8.7% a year earlier.
What drove Galaxy Surfactants' H1FY27 earnings recovery?
Galaxy Surfactants attributed the recovery to high-single-digit consolidated volume growth, disciplined pricing, a favourable product mix and improved operating leverage. Net revenue from operations increased 37.9% to Rs 3,592.3 crore in H1FY27 from Rs 2,604.1 crore in H1FY26.
Performance Surfactants generated Rs 2,304 crore of H1FY27 revenue and Specialty Care Products generated Rs 1,288 crore. Their shares of H1 net revenue were 64% and 36%, respectively, unchanged from H1FY26; in Q2FY27, Performance Surfactants' share increased to 65% from 63% a year earlier.
The volume trend differed by segment. Galaxy Surfactants reported high-single-digit H1FY27 volume growth in Performance Surfactants and low-single-digit growth in Specialty Care Products. In Q2FY27, Performance Surfactants delivered mid-teens volume growth while Specialty Care Products volumes were flat, although management cited sustained momentum in premium and masstige Specialty Care products.
Profit increased faster than revenue in the first half. H1FY27 PAT margin was 7.9%, compared with 1.2% in H1FY26 as presented by the company, while Q2FY27 PAT margin increased to 6.6% from 5.0%. These margin movements accompanied the reported gains in pricing, mix and operating leverage.
Which markets supported Galaxy Surfactants' volume growth?
Galaxy Surfactants reported mid-teens volume growth in India in both Q2FY27 and H1FY27 across Performance Surfactants and Specialty Care Products. Management attributed the India performance to healthy demand from Tier-1, non-Tier-1 and D2C customers, and India represented 44% of H1FY27 revenue, unchanged from H1FY26.
AMET recorded mid-teens volume growth in Q2FY27 and mid-single-digit growth in H1FY27, supported by demand from Tier-1 and non-Tier-1 customers despite geopolitical volatility. AMET's Q2FY27 revenue share rose to 23% from 21% in Q2FY26, while its H1FY27 share remained 21%.
Rest of World volumes declined in the high single digits in Q2FY27 because supply-chain disruptions affected Asia-Pacific and Europe. H1FY27 Rest of World volume was flat and the region accounted for 35% of H1 revenue, the same share as in H1FY26; management said premium and masstige Specialty Care volumes in the Americas remained resilient.
Customer composition changed modestly during the half. Multinational customers accounted for 49% of H1FY27 revenue, up from 48% in H1FY26, while regional players remained at 9% and local and niche customers represented 42%, down from 43%.
Got a follow-up? Ask IRIS
What cost and cash-flow factors should investors track?
Galaxy Surfactants said raw-material markets remained volatile in Q2FY27 amid supply-chain disruption linked to developments in West Asia. Fatty alcohol averaged $2,763 per metric tonne in Q2FY27, below $2,806 in Q1FY27 and $2,800 in Q2FY26, while management said petrochemical feedstock costs remained high and availability tight.
Costs rose with the larger revenue base. H1FY27 material consumption was Rs 2,572 crore, compared with Rs 1,944 crore in H1FY26; employee benefits expense increased to Rs 204.6 crore from Rs 164 crore, and other expenses rose to Rs 376.9 crore from Rs 261.7 crore. EBITDA nevertheless increased by Rs 197 crore year on year.
Operating cash flow declined despite the higher PAT. Net cash generated from operating activities was Rs 76.6 crore in H1FY27, against Rs 169.4 crore in H1FY26, while inventories increased to Rs 1,024.2 crore at September 2026 from Rs 793.7 crore at March 2026 and trade receivables rose to Rs 1,113.4 crore from Rs 750.4 crore.
Cash and cash equivalents stood at Rs 265.5 crore at September 2026, compared with Rs 109.1 crore at March 2026. Galaxy Surfactants reported Rs 116.1 crore of cash generated from investing activities in H1FY27, a Rs 37.6 crore financing cash outflow, and an interim dividend approval of Rs 18 per share.
What has Galaxy Surfactants said about the rest of FY27?
Galaxy Surfactants management said demand indicators remained encouraging in India, AMET and Specialty Care across geographies after H1FY27 consolidated volume growth in the high single digits. Management said an improving business mix and continued Specialty Care momentum supported its confidence in sustainable and profitable growth.
Management also said it remained vigilant about developments in West Asia and their possible implications for global logistics, freight rates and feedstock availability. The contrast between mid-teens Q2FY27 volume growth in India and AMET and the high-single-digit decline in Rest of World volumes illustrates the disruption that could affect subsequent periods.
Conclusion
Galaxy Surfactants' H1FY27 earnings recovery placed consolidated PAT at Rs 285.7 crore, above the Rs 267.4 crore earned in FY26, while total revenue reached Rs 3,602 crore and EBITDA margin rose to 12.4%. Management linked the result to volume growth, pricing discipline, product mix and operating leverage, with India and AMET contributing reported volume growth.
The next results will show whether Rest of World volumes recover after their high-single-digit Q2FY27 decline and whether H1FY27 operating cash flow of Rs 76.6 crore improves as inventories and receivables are managed. Management has also identified West Asia developments, freight rates and feedstock availability as unresolved factors that could affect logistics and raw-material conditions.