










GAMCO H1 FY27 profit reaches Rs 38.49 crore after FY26 loss
Key highlights
- GAMCO reported PAT of Rs 38.49 crore in H1 FY27 after a Rs 47.14 crore loss in FY26.
- GAMCO’s H1 FY27 EBITDA was Rs 52.85 crore, compared with a Rs 28.12 crore loss in FY26.
- GAMCO’s borrowings increased to Rs 327.41 crore in H1 FY27 from Rs 287.94 crore in FY26.
- GAMCO’s inventories reached Rs 228.23 crore and total assets reached Rs 556.49 crore in H1 FY27.
powered by IRIS
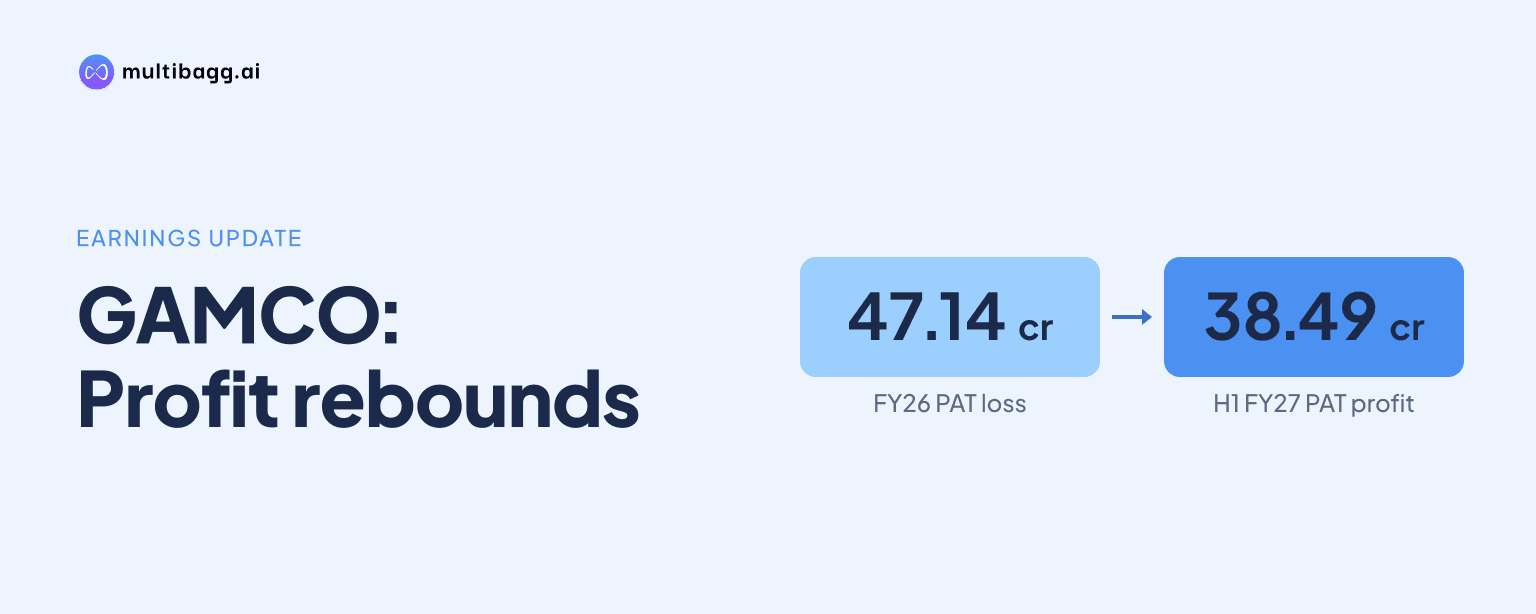
GAMCO reported profit after tax of Rs 38.49 crore in H1 FY27, reversing a Rs 47.14 crore loss in FY26, as total revenue was Rs 254.66 crore and EBITDA reached Rs 52.85 crore; borrowings also rose to Rs 327.41 crore.
Know Gamco inside out
Results, valuation, peers and who's buying, in one view.
How did GAMCO return to profit in H1 FY27?
GAMCO returned to profitability in H1 FY27 with profit after tax (PAT) of Rs 38.49 crore and a PAT margin of 15.15%, compared with a Rs 47.14 crore loss and a negative 15.64% margin in FY26. Profit before tax moved to Rs 41.42 crore from a FY26 loss of Rs 44.68 crore, while tax expense was Rs 2.81 crore.
Earnings before interest, tax, depreciation and amortisation (EBITDA) were Rs 52.85 crore in H1 FY27, compared with a negative Rs 28.12 crore in FY26. EBITDA margin changed to 20.80% from negative 9.33%, while total revenue was Rs 254.66 crore and expenses were Rs 201.81 crore, versus FY26 revenue of Rs 302.17 crore and expenses of Rs 330.29 crore. H1 FY27 is a six-month period, unlike the full-year FY26 comparison.
GAMCO’s financial-performance page lists H1 FY27 revenue from operations at Rs 254.66 crore, while its detailed income statement lists revenue from operations of Rs 254.09 crore and other income of Rs 0.57 crore. The detailed statement’s total revenue of Rs 254.66 crore also matches the combined Q1 FY27 and Q2 FY27 total revenue figures.
What changed in GAMCO’s Q2 FY27 earnings?
GAMCO’s Q2 FY27 revenue rose from Q1 FY27, but profit declined. Revenue from operations increased 24% quarter on quarter to Rs 140.58 crore from Rs 113.51 crore, while PAT fell 81% to Rs 6.06 crore from Rs 32.43 crore. Total revenue was Rs 140.94 crore in Q2 FY27 against Rs 113.72 crore in Q1 FY27.
GAMCO’s expenses increased to Rs 128.78 crore in Q2 FY27 from Rs 73.03 crore in Q1 FY27, reducing EBITDA to Rs 12.16 crore from Rs 40.69 crore. EBITDA margin declined to 9% from 36%, while PAT margin fell to 4% from 29%. Finance cost rose to Rs 5.81 crore from Rs 5.19 crore.
GAMCO nevertheless improved from the prior-year quarter, when Q2 FY26 recorded total revenue of Rs 87.18 crore, EBITDA loss of Rs 6.79 crore and PAT loss of Rs 8.30 crore. In Q2 FY27, total revenue was Rs 140.94 crore, EBITDA was Rs 12.16 crore and PAT was Rs 6.06 crore; the presentation reports 51% year-on-year total-revenue growth and 173% year-on-year PAT growth.
Got a follow-up? Ask IRIS
How did GAMCO’s balance sheet change in H1 FY27?
GAMCO’s total assets increased by Rs 47.39 crore to Rs 556.49 crore in H1 FY27 from Rs 509.10 crore in FY26. Its largest reported asset categories were inventories at Rs 228.23 crore and loans and investments at Rs 215.69 crore. Inventories increased by Rs 47.88 crore, while loans and investments increased by Rs 20.13 crore.
Property, plant and equipment increased to Rs 50.10 crore from Rs 28.71 crore, while goodwill and intangible assets declined to Rs 43.32 crore from Rs 90.24 crore. Trade receivables rose to Rs 8.23 crore from Rs 3.21 crore, while cash and bank balances declined to Rs 0.60 crore from Rs 1.09 crore.
GAMCO’s borrowings increased by Rs 39.47 crore to Rs 327.41 crore in H1 FY27 from Rs 287.94 crore in FY26. Shareholders’ fund rose to Rs 205.91 crore from Rs 166.51 crore, and minority interest was Rs 0.71 crore. The presentation reports net worth of Rs 206.62 crore, comprising shareholders’ fund and minority interest, compared with Rs 167.19 crore in FY26.
What does GAMCO’s recent financial record show?
GAMCO’s revenue from operations moved from Rs 22.47 crore in FY22 to Rs 220.55 crore in FY24, fell to Rs 61.51 crore in FY25 and reached Rs 301.41 crore in FY26. PAT moved from Rs 0.13 crore in FY22 to a loss of Rs 8.50 crore in FY23, followed by profits of Rs 33.20 crore in FY24 and Rs 6.44 crore in FY25 before the FY26 loss of Rs 47.14 crore.
GAMCO’s EBITDA margin was 20.85% in FY24 and 25.45% in FY25, before turning negative at 9.33% in FY26 and returning to 20.80% in H1 FY27. PAT margin followed a similar change, at 15.06% in FY24, 10.48% in FY25, negative 15.64% in FY26 and 15.15% in H1 FY27.
GAMCO identifies structured real-estate financing, secured lending against quality assets, strategic partnerships, asset monetisation and potential asset-backed recurring cash flows as opportunities. The presentation does not provide an earnings target, borrowing target or timetable for these activities. It cites projected Grade A/A+ warehousing stock of 530 million square feet in FY27 and 850 million square feet in FY30 as industry projections, not as GAMCO forecasts.
Conclusion
GAMCO’s H1 FY27 results show an earnings reversal, with PAT of Rs 38.49 crore and EBITDA of Rs 52.85 crore following FY26 losses of Rs 47.14 crore and Rs 28.12 crore, respectively. The balance sheet also expanded to Rs 556.49 crore, with inventories of Rs 228.23 crore, loans and investments of Rs 215.69 crore and borrowings of Rs 327.41 crore.
The next reported period will indicate whether GAMCO can sustain the H1 outcome after Q2 FY27 PAT of Rs 6.06 crore was below Q1 FY27 PAT of Rs 32.43 crore. Investors can also monitor the disclosed financing, secured-lending, partnership and asset-monetisation plans, as well as changes in inventories, receivables, cash balances and borrowings.