










Gland Pharma cash cycle falls to 158 days as ROCE reaches 13%
Key highlights
- Gland’s cash conversion cycle declined to 158 days in 6M FY27 from 172 days in FY25.
- Gland’s ROCE rose to 13% in 6M FY27 from 9% in FY25.
- Gland reported net cash of Rs 3,221.6 crore in 6M FY27, versus Rs 3,115.7 crore in FY26.
- Gland’s fixed-asset turnover increased to 1.7 times in 6M FY27 from 1.4 times in FY25.
powered by IRIS
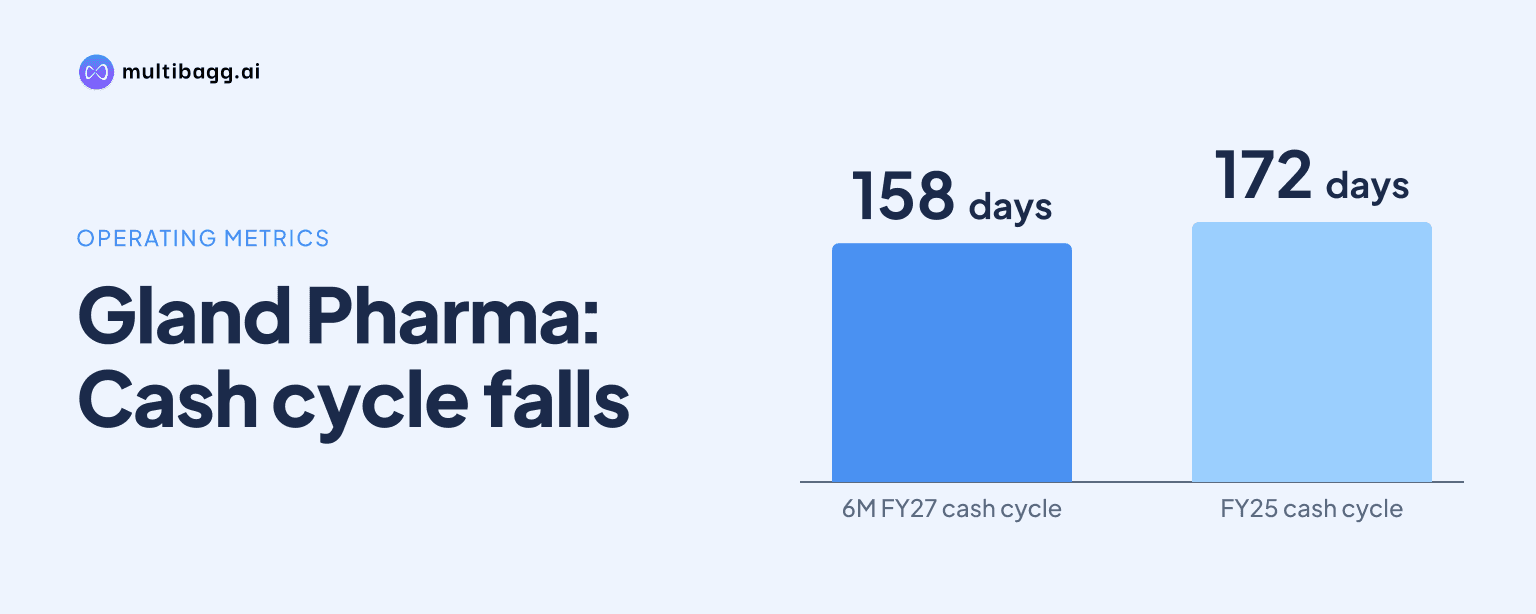
Gland Pharma reported a 158-day cash conversion cycle in 6M FY27, down 14 days from FY25’s 172 days, while return on capital employed reached 13% from 9%. Lower inventory and receivable days coincided with higher asset-turnover ratios and net cash of Rs 3,221.6 crore.
Know Gland Pharma inside out
Results, valuation, peers and who's buying, in one view.
How did Gland shorten its cash conversion cycle?
Gland shortened its reported cash conversion cycle to 158 days in 6M FY27 from 164 days in FY26 and 172 days in FY25. Inventory days declined to 123 from 130 in FY26 and 138 in FY25, while receivable days fell to 96 from 97 and 100, respectively.
Gland reported payable days of -61 in 6M FY27, compared with -63 in FY26 and -66 in FY25. The presentation defines the cash conversion cycle using receivable, inventory and payable days; receivable days are based on average trade receivables and revenue from operations, while inventory days are based on average inventory and cost of goods sold.
The 15-day decline in inventory days between FY25 and 6M FY27 was larger than the four-day reduction in receivable days over the same periods. Net working capital increased to Rs 2,595.5 crore in 6M FY27 from Rs 2,485.5 crore in FY26 and Rs 2,168.3 crore in FY25; Gland defines it as current assets excluding cash and bank balances less current liabilities.
How did Gland’s returns and asset utilisation change?
Gland’s return on capital employed, or ROCE, rose to 13% in 6M FY27 from 11% in FY26 and 9% in FY25. The presentation defines ROCE as earnings before interest and tax, or EBIT, divided by average capital employed, with capital employed calculated as total assets less current liabilities.
Return on net worth, or RONW, was 11% in 6M FY27, unchanged from FY26 but above FY25’s 8%. Net worth increased from Rs 9,150.7 crore in FY25 to Rs 10,358 crore in FY26 and Rs 10,685.7 crore in 6M FY27; it consists of equity share capital and other equity.
Gland’s total asset turnover increased to 0.6 times in 6M FY27 after remaining at 0.5 times in both FY25 and FY26. Fixed-asset turnover rose to 1.7 times from 1.5 times in FY26 and 1.4 times in FY25; the measure uses revenue from operations divided by average total fixed assets, including property, plant and equipment, right-of-use assets and capital work in progress.
Got a follow-up? Ask IRIS
What do Gland’s cash and investment figures show?
Gland reported total cash of Rs 3,441.2 crore and net cash of Rs 3,221.6 crore in 6M FY27, compared with Rs 3,359.1 crore and Rs 3,115.7 crore, respectively, in FY26. Net cash is cash and cash equivalents less total borrowings, including current maturities.
FY25 total cash was Rs 2,556.2 crore and net cash was Rs 2,287 crore, although the total-cash figure excluded Rs 396 crore of non-callable deposits. On the disclosed basis, net cash was Rs 934.6 crore higher in 6M FY27 than in FY25, while total cash was Rs 885 crore higher.
Cash flow from operations was Rs 602.7 crore in 6M FY27, following Rs 1,031.4 crore in FY26 and Rs 914.7 crore in FY25. The 6M FY27 figure covers six months, whereas the FY25 and FY26 figures cover full financial years, so the reported period totals are not directly comparable.
Capital expenditure was Rs 256.2 crore in 6M FY27, after Rs 493.8 crore in FY26 and Rs 393.8 crore in FY25. The presentation reports this half-year investment alongside 0.6-times total asset turnover, 1.7-times fixed-asset turnover and 13% ROCE in 6M FY27.
What operating developments accompanied Gland’s efficiency measures?
Gland generated revenue from operations of Rs 3,633.9 crore in 6M FY27, up 21% from Rs 2,992.5 crore in 6M FY26. Adjusted earnings before interest, tax, depreciation and amortisation, or adjusted EBITDA, rose 43% to Rs 1,013.2 crore, and adjusted EBITDA margin increased to 28% from 24%.
Profit after tax increased 52% to Rs 607.7 crore in 6M FY27 from Rs 399.2 crore a year earlier, while its margin rose to 17% from 13%. In Q2 FY27, revenue was Rs 1,833.6 crore, 23% above Q2 FY26’s Rs 1,486.9 crore and 2% above Q1 FY27’s Rs 1,800.3 crore.
The contract development and manufacturing organisation, or CDMO, business contributed Rs 1,714.2 crore in 6M FY27, up 25% year on year, while Critical Injectables contributed Rs 1,919.7 crore, up 18%. Gland attributed CDMO growth to recent product launches and increased volumes, and attributed Critical Injectables growth to new launches and greater demand from existing customers.
Research and development expenditure was Rs 184.9 crore in 6M FY27, equal to 5% of consolidated revenue, versus Rs 148.1 crore and 5% in 6M FY26. In Q2 FY27, Gland filed 11 abbreviated new drug applications, or ANDAs, and received 10 approvals, taking cumulative United States ANDA filings to 399, including 350 approved and 49 pending.
Conclusion
Gland’s reported data combines a shorter cash conversion cycle with rising returns and asset turnover in 6M FY27. Inventory days fell by 15 days from FY25, receivable days fell by four days, and ROCE increased by four percentage points to 13%, while revenue and adjusted EBITDA rose 21% and 43%, respectively, year on year.
Investors can watch the timing of Gland’s product pipeline and CDMO execution. Management said three in-house complex products were in line for approval, 15 co-development products were anticipated to begin commercialisation in FY29, and technology-transfer work with a global pharmaceutical company was advancing according to plan.