










Goldiam returned over Rs 250 crore through five-year payouts
Key highlights
- Goldiam says it distributed more than Rs 250 crore through dividends and buybacks over the last five years.
- Goldiam reported dividends plus buybacks equal to 84% of standalone PAT in FY26, compared with 34% in FY25.
- Goldiam’s FY26 consolidated PAT was Rs 170.6 crore, up from Rs 117.1 crore in FY25.
- Goldiam reported FY26 revenue from operations of Rs 1,021.2 crore and EBITDA margin of 24.3%.
powered by IRIS
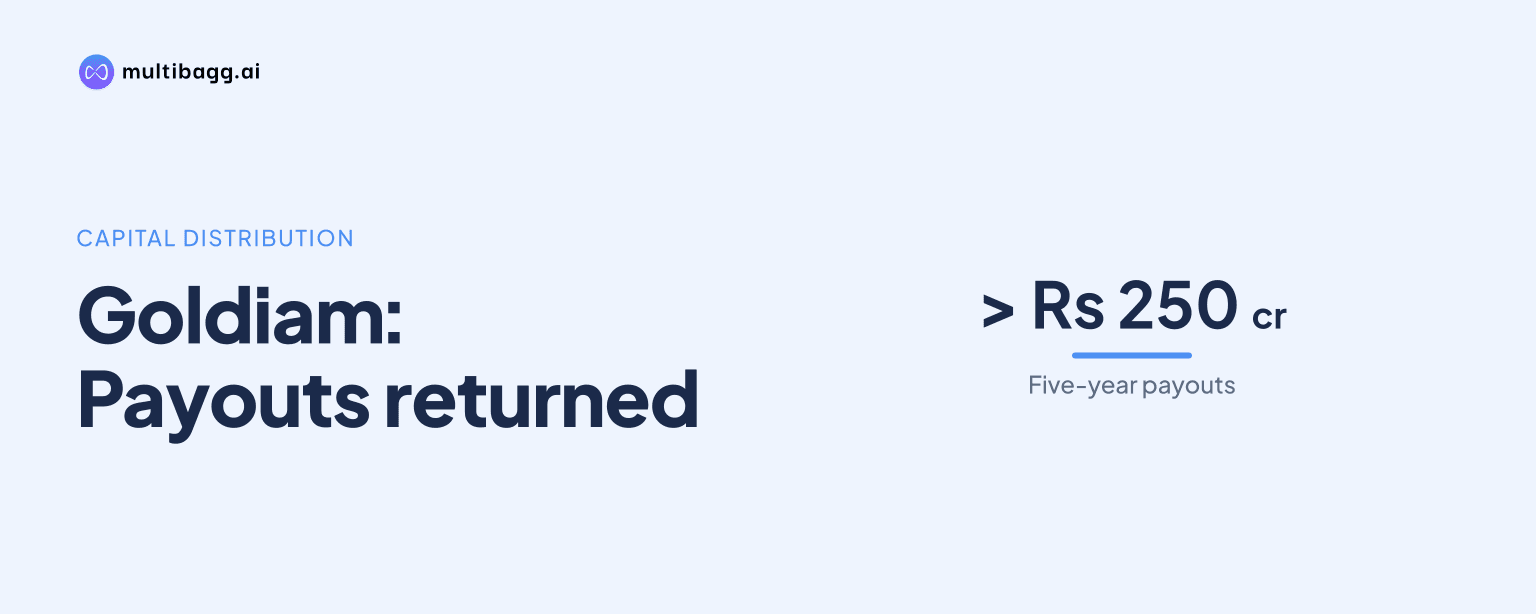
Goldiam International Limited says it returned more than Rs 250 crore to shareholders through dividends and buybacks over the last five years, while consolidated profit after tax reached Rs 170.6 crore in FY26, compared with Rs 106 crore in FY22. Goldiam’s policy aims to allocate at least 50% of annual standalone profit after tax to dividends and/or buybacks.
Know Goldiam International inside out
Results, valuation, peers and who's buying, in one view.
How much has Goldiam distributed to shareholders?
Goldiam says it distributed more than Rs 250 crore through dividends and share buybacks during the last five years. The presentation does not provide a year-by-year rupee split between dividends and buybacks, but it identifies the aggregate amount as shareholder distributions and reports annual payout ratios against standalone profit after tax, or PAT.
Goldiam’s dividend-plus-buyback ratio varied across the reported periods. It was 90.8% of standalone PAT in FY22 and 91% in FY23, then fell to 55% in FY24 and 34% in FY25 before recovering to 84% in FY26. The reported pattern shows that annual distributions have not remained at a fixed proportion of standalone earnings.
In FY26, Goldiam’s standalone PAT was Rs 50.5 crore, down from Rs 62.9 crore in FY25, while the dividend-and-buyback ratio rose by 50 percentage points to 84% from 34%. The presentation describes the distribution approach as balancing dividends paid with profits retained for future growth.
What is Goldiam's shareholder payout policy?
Goldiam aims to maintain a minimum payout ratio of 50% of annual standalone PAT through dividends and/or buybacks, subject to the considerations in its distribution policy. The policy uses standalone earnings rather than consolidated earnings, which is significant because FY26 consolidated PAT of Rs 170.6 crore was more than three times standalone PAT of Rs 50.5 crore.
Goldiam says the objective of its dividend distribution policy is to balance the quantum of dividends paid with profits preserved for future growth. The 50% threshold is an aim rather than an unconditional commitment because the presentation states that it remains subject to policy parameters not detailed in the supplied material.
Goldiam’s disclosed annual ratios have been both below and above the 50% aim. FY25 was below it at 34%, while FY18 through FY24 ranged from 55% to 165.5%, and FY26 was 84%; the FY19 ratio exceeded standalone PAT of Rs 19.6 crore, although the presentation does not explain the funding source for distributions above that year’s profit.
Goldiam also reported a dividend per share of Rs 3.75 in FY26, compared with Rs 2 in FY25 and Rs 1.20 in FY24. Dividend per share is only one component of the stated shareholder-return framework because the policy also permits buybacks.
Got a follow-up? Ask IRIS
How did Goldiam's profit base change before FY26 payouts?
Goldiam’s consolidated PAT increased to Rs 170.6 crore in FY26 from Rs 117.1 crore in FY25, an increase of Rs 53.5 crore, while PAT margin rose to 16.7% from 14.6%. Across FY22 to FY26, consolidated PAT increased by Rs 64.6 crore from Rs 106 crore.
Revenue from operations reached Rs 1,021.2 crore in FY26, compared with Rs 800.7 crore in FY25 and Rs 687.7 crore in FY22. Revenue did not rise continuously over the period: it declined to Rs 553.1 crore in FY23 before increasing in each of the following three financial years.
Earnings before interest, tax, depreciation and amortisation, or EBITDA, rose to Rs 248.7 crore in FY26 from Rs 182.6 crore in FY25. EBITDA margin increased by 1.5 percentage points to 24.3% from 22.8%, and was also above the 20.8% reported in FY24.
The difference between consolidated and standalone profits affects how the payout policy is read. Consolidated PAT rose from Rs 117.1 crore in FY25 to Rs 170.6 crore in FY26, while standalone PAT declined from Rs 62.9 crore to Rs 50.5 crore, so a policy linked to standalone earnings can produce a different result from one based on group profit.
What financial position does Goldiam report alongside payouts?
Goldiam reported cash and investments equal to 44.6% of equity in FY26, compared with 38.7% in FY25 and 49.3% in FY24. Elsewhere in the presentation, Goldiam says consolidated cash and investments exceeded Rs 458 crore in September 2026 and describes its structure as having zero net debt.
Goldiam reported FY26 equity of Rs 1,106 crore and debt of Rs 3.50 crore, with debt-to-equity displayed as 0.00. In FY25, equity was Rs 743.1 crore and debt was Rs 8.6 crore, with debt-to-equity displayed as 0.01, meaning FY26 combined higher reported equity with lower debt.
Net working capital days declined to 136 in FY26 from 211 in FY25. Receivable days fell to 52 from 68 and inventory days fell to 109 from 177, while payable days decreased to 25 from 34; the presentation does not quantify free cash flow available for dividends or buybacks.
Goldiam reported cash-adjusted return on capital employed of 43.3% in FY26, compared with 43.9% in FY25 and 37.1% in FY24. Return on equity was 18.4% in FY26, up from 17.0% in FY25 but below 21.0% in FY22, and the presentation does not provide target ranges for either measure.
Conclusion
Goldiam’s disclosed shareholder-return record combines more than Rs 250 crore of dividends and buybacks over five years with a policy that aims to allocate at least 50% of standalone PAT to those routes. The annual ratios varied from 34% in FY25 to 84% in FY26, while FY26 consolidated PAT reached Rs 170.6 crore and revenue reached Rs 1,021.2 crore.
The next point to watch is whether Goldiam maintains its stated 50% standalone-PAT payout aim after FY26, when standalone PAT fell to Rs 50.5 crore despite higher consolidated profit. Goldiam also reports cash and investments exceeding Rs 458 crore in September 2026, but the presentation does not disclose a future dividend amount, buyback amount or timetable.