










India wind additions rose to 6.1 GW in FY26, 3.2 GW in H1 FY27
Key highlights
- India installed a record 6,057 MW of wind capacity in FY26, up from 4,151 MW in FY25.
- India installed 3.2 GW of wind capacity in H1 FY27, including 1.8 GW in Q2 FY27.
- Wind, hybrid, FDRE and RTC categories accounted for 3.1 GW, or 53%, of 5.8 GW of Q2 FY27 renewable awards.
- India’s renewable capacity excluding large hydro reached about 247 GW in September 2026, including 59.2 GW of wind.
powered by IRIS
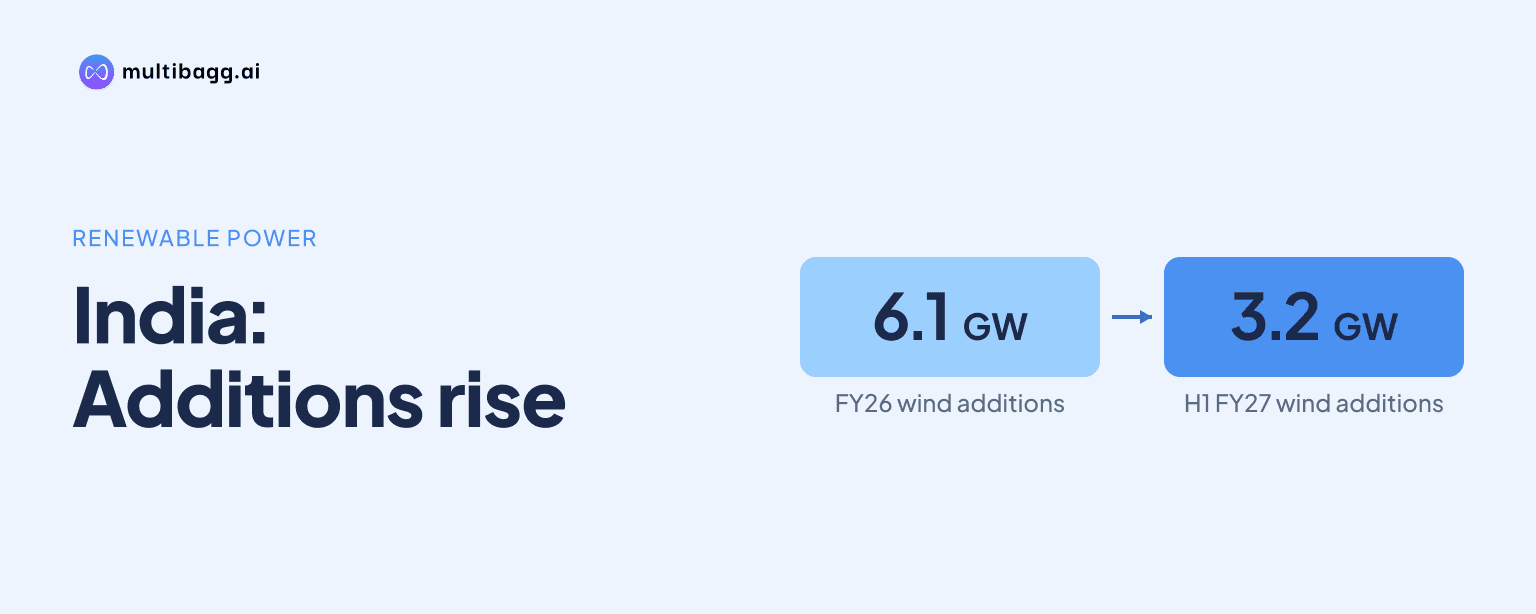
India added 6,057 megawatts (MW), or 6.1 gigawatts (GW), of wind capacity in FY26 and 3.2 GW in H1 FY27, after adding 4,151 MW in FY25, according to the presentation. The increase coincided with 3.1 GW of Q2 FY27 tender awards in wind, hybrid, firm and dispatchable renewable energy (FDRE) and round-the-clock (RTC) categories.
Know Inox Wind inside out
Results, valuation, peers and who's buying, in one view.
How did India’s wind installations change in FY26?
India’s wind installations reached 6,057 MW in FY26, rising by 1,906 MW from 4,151 MW in FY25 and setting the highest annual level shown in the presentation. FY26 additions also exceeded the 3,253 MW installed in FY24, 2,275 MW in FY23 and 1,111 MW in FY22, marking a sustained increase over the last three financial years.
The FY26 result was above the prior peak of 4,151 MW in FY25, while cumulative wind capacity reached 56,092 MW in March 2026. India had added 34,145 MW until FY18, then recorded additions ranging from 1,111 MW in FY22 to 3,253 MW in FY24 before the FY25 and FY26 acceleration.
Wind growth occurred alongside a larger expansion in utility-scale solar capacity. Utility-scale solar additions increased from 16,900 MW alternating current (AC) in FY25 to 34,848 MW AC in FY26, a rise of 17,948 MW AC; the presentation identifies FY26 as the highest-ever installation year for both technologies.
What did India add in H1 FY27?
India installed 3.2 GW of wind capacity in H1 FY27, including 1.8 GW in Q2 FY27, according to the presentation. Total renewable energy (RE) additions in Q2 FY27 were 10.7 GW, placing wind at 16% of quarterly additions and solar at 84%.
Solar contributed 8.9 GW of Q2 FY27 renewable additions, compared with 1.8 GW from wind, while small hydro and other technologies were shown as 0.0 GW. Solar therefore remained the larger source of new quarterly capacity, even as the first-half wind total reached more than half of FY26’s 6,057 MW addition.
India’s RE capacity excluding large hydro was about 247 GW in September 2026, comprising 171.1 GW of solar, 59.2 GW of wind, 11.7 GW of biomass and other sources, and 5.2 GW of small hydro. The September wind total was about 3.1 GW above the 56,092 MW reported in March 2026, broadly aligning with the stated 3.2 GW H1 FY27 installation figure.
The demand backdrop was also higher in FY27 year to date: power demand rose 15% year on year in Q2 and 13% in H1. The presentation shows per-capita electricity consumption increasing from 1,538 in FY25 to 2,000 by 2030 and 4,000 by 2047, based on a stated 4% compound annual growth rate.
Got a follow-up? Ask IRIS
How do Q2 FY27 tender awards support wind demand?
Wind-linked categories accounted for 3.1 GW, or 53%, of the 5.8 GW of renewable capacity awarded through tenders in Q2 FY27. The award mix comprised 2.1 GW of wind, 1.0 GW of FDRE and RTC capacity, 1.2 GW of solar, and 1.5 GW of solar plus storage.
The presentation estimates Q2 FY27 awards could represent about 2.3 GW to 2.4 GW of wind capacity if wind supplies 20% to 30% of FDRE and RTC capacity. This estimate combines the 2.1 GW of direct wind awards with an assumed wind component in the 1.0 GW FDRE and RTC category, rather than a disclosed final technology allocation.
The presentation says wind has a generation profile complementary to solar and that FDRE and RTC projects will form a larger share of upcoming tenders. In Q2 FY27, direct wind awards of 2.1 GW were already larger than the 1.2 GW awarded to solar-only projects, although solar plus storage added another 1.5 GW to the tender mix.
India is expected to add 7.5 GW to 8 GW of wind capacity in FY27, according to the Ministry of New and Renewable Energy expectation cited in the presentation. The presentation also gives a broader near-term outlook of 8 GW to 10 GW of annual wind installations; these are outlook figures rather than reported additions.
What capacity targets frame India’s wind market growth?
India targets 500 GW of non-fossil-fuel capacity by 2030 and 1,800 GW by 2047, according to the presentation. One target chart shows wind capacity rising from 57 GW currently to 110 GW in 2030 and 400 GW in 2047, alongside solar increasing from 162 GW to 280 GW and 1,200 GW, respectively.
A separate outlook chart uses a 2026 base of 59 GW of wind and 171 GW of solar, rising to 100 GW of wind and 280 GW of solar in 2030. It then shows 160 GW of wind in 2035 and 400 GW in 2047, while solar reaches 500 GW in 2035 and 900 GW in 2047; the presentation therefore displays both 100 GW and 110 GW as 2030 wind reference points.
At the 559 GW total installed power capacity shown in the presentation, wind represented 59 GW, or 10%, and solar represented 171 GW, or 31%. Thermal capacity was 251 GW, or 45%, while hydro including small hydro was 57 GW, or 10%; wind and solar together made up 41% of installed capacity.
The 2026-to-2047 outlook chart shows combined wind and solar capacity increasing from 230 GW to 1,300 GW. Within that chart, wind rises from 59 GW to 400 GW, which the presentation characterises as about seven times current capacity, while solar rises from 171 GW to 900 GW.
Conclusion
India’s FY26 wind addition of 6,057 MW, followed by 3.2 GW in H1 FY27, shows a higher installation run rate than the 4,151 MW recorded in FY25. The tender data adds a prospective demand indicator: 3.1 GW, or 53%, of Q2 FY27 renewable awards were in wind, hybrid, FDRE or RTC categories rather than solar-only projects.
The next measures to watch are whether FY27 installations reach the cited 7.5 GW to 8 GW expectation and how much wind is ultimately included in FDRE and RTC awards. The presentation’s two 2030 wind-capacity reference points, 100 GW and 110 GW, also leave future tender execution and installed-capacity reporting as key indicators of progress.