










Indo SMC FY26 revenue reached Rs 309.74 crore as leverage fell
Key highlights
- Indo SMC reported FY26 revenue from operations of Rs 309.74 crore, versus Rs 28.03 crore in FY24.
- Indo SMC's FY26 PAT was Rs 32.38 crore, compared with Rs 3.00 crore in FY24.
- Indo SMC's debt-to-equity ratio declined to 0.30 times in FY26 from 3.05 times in FY24.
- Indo SMC held Rs 53.55 crore in cash and bank balances and Rs 85.08 crore of inventory in FY26.
powered by IRIS
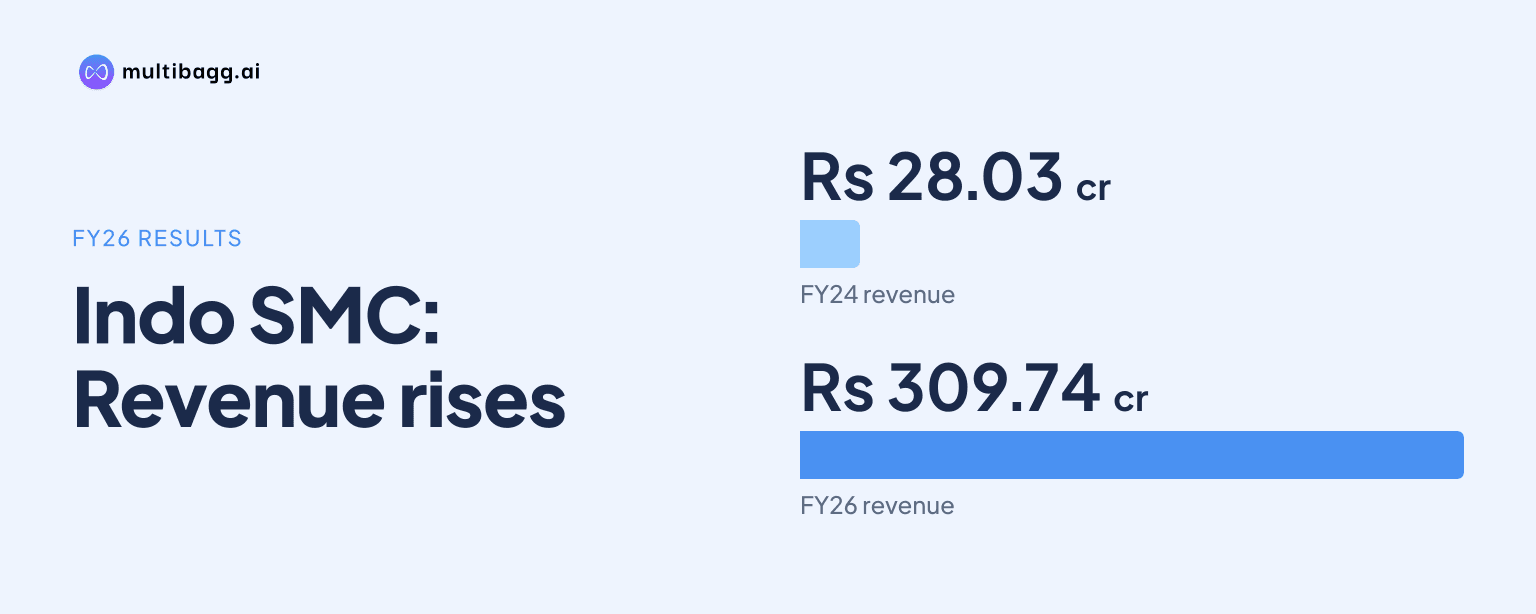
Indo SMC Limited reported FY26 revenue from operations of Rs 309.74 crore, up from Rs 28.03 crore in FY24, while its debt-to-equity ratio declined to 0.30 times from 3.05 times. The presentation also records FY26 profit after tax of Rs 32.38 crore, net worth of Rs 154.11 crore and cash and bank balances of Rs 53.55 crore.
Know Indo SMC inside out
Results, valuation, peers and who's buying, in one view.
How much did Indo SMC grow between FY24 and FY26?
Indo SMC increased revenue from operations more than elevenfold over the two-year period, from Rs 28.03 crore in FY24 to Rs 138.69 crore in FY25 and Rs 309.74 crore in FY26. FY26 revenue was Rs 171.05 crore higher than FY25 revenue, following an FY25 increase of Rs 110.66 crore from FY24. The financial-highlights page separately states revenue growth of 100%, without identifying the measurement period.
Earnings increased over the same three financial years. Earnings before interest, tax, depreciation and amortisation, or EBITDA, rose from Rs 5.08 crore in FY24 to Rs 23.49 crore in FY25 and Rs 47.65 crore in FY26. Profit after tax, or PAT, moved from Rs 3.00 crore to Rs 16.83 crore and then Rs 32.38 crore, while earnings per share rose from Rs 2.19 to Rs 10.48 and Rs 18.09.
Indo SMC's FY26 expansion in revenue was larger in absolute terms than the preceding year, but the presentation's reported EBITDA growth figure was 83% and its PAT growth figure was 97%, with neither figure linked to a stated comparison period. From FY25 to FY26, EBITDA increased by Rs 24.15 crore and PAT by Rs 15.55 crore. Total income, including other income, reached Rs 310.50 crore in FY26.
What changed in Indo SMC's FY26 cost and profit structure?
Indo SMC reported higher costs alongside its FY26 revenue increase, with raw-material expense rising to Rs 229.24 crore from Rs 102.18 crore in FY25 and Rs 17.20 crore in FY24. Raw materials remained the largest listed expense in every period. In FY26, this cost category increased by Rs 127.06 crore from FY25, against the Rs 171.05 crore rise in revenue from operations.
Other expenses increased to Rs 28.21 crore in FY26 from Rs 9.83 crore in FY25 and Rs 4.39 crore in FY24. Employee-benefit expense rose to Rs 5.40 crore, compared with Rs 3.28 crore a year earlier and Rs 1.30 crore in FY24. Total expenses consequently reached Rs 262.85 crore in FY26, up from Rs 115.29 crore in FY25.
Finance costs rose to Rs 5.67 crore in FY26 from Rs 3.55 crore in FY25, while depreciation and amortisation expense increased to Rs 1.44 crore from Rs 0.83 crore. Profit before tax was Rs 40.54 crore, compared with Rs 18.98 crore in FY25 and Rs 3.69 crore in FY24. Tax expense was Rs 8.15 crore in FY26, resulting in the reported PAT of Rs 32.38 crore.
Other income was Rs 0.76 crore in FY26, compared with Rs 0.09 crore in FY25 and Rs 0.03 crore in FY24. Total income therefore exceeded revenue from operations by Rs 0.76 crore in FY26. The income statement shows EBITDA of Rs 47.65 crore before the FY26 finance cost and depreciation charges, compared with Rs 23.49 crore in FY25.
Got a follow-up? Ask IRIS
How did Indo SMC's leverage and liquidity change?
Indo SMC's debt-to-equity ratio fell to 0.30 times in FY26 from 0.97 times in FY25 and 3.05 times in FY24. This movement coincided with net worth rising to Rs 154.11 crore in FY26 from Rs 36.78 crore in FY25 and Rs 5.79 crore in FY24. Reserves and surplus increased to Rs 131.26 crore, while share capital was Rs 22.86 crore.
Short-term borrowings nonetheless increased to Rs 42.45 crore in FY26 from Rs 29.84 crore in FY25 and Rs 13.15 crore in FY24. Long-term borrowings decreased to Rs 4.50 crore from Rs 5.92 crore a year earlier, and were close to the FY24 balance of Rs 4.55 crore. Total current liabilities were Rs 64.98 crore in FY26, compared with Rs 57.12 crore in FY25.
The current ratio, which compares current assets with current liabilities, improved to 2.98 times in FY26 from 1.29 times in FY25 and 1.02 times in FY24. Current assets reached Rs 193.60 crore, while current liabilities were Rs 64.98 crore. Cash and bank balances increased to Rs 53.55 crore from Rs 2.88 crore in FY25 and Rs 0.28 crore in FY24.
Which asset movements and returns should readers track?
Indo SMC's FY26 asset growth was concentrated in current assets, which rose to Rs 193.60 crore from Rs 73.93 crore in FY25. Inventories increased to Rs 85.08 crore from Rs 17.23 crore, an increase of Rs 67.85 crore. Short-term loans and advances also rose to Rs 18.75 crore from Rs 6.57 crore.
Trade receivables moved in the opposite direction, declining to Rs 35.75 crore in FY26 from Rs 47.21 crore in FY25, although they remained above the FY24 level of Rs 8.61 crore. Total assets reached Rs 224.43 crore, compared with Rs 99.94 crore in FY25 and Rs 36.32 crore in FY24. Non-current assets increased to Rs 30.83 crore from Rs 26.00 crore.
Property, plant and equipment and intangible assets rose to Rs 29.21 crore in FY26 from Rs 23.73 crore in FY25 and Rs 7.52 crore in FY24. The presentation describes investments in advanced production technologies, automation and process optimisation as part of its manufacturing-capacity expansion priority. It does not disclose a capital-expenditure amount, capacity addition or completion date for that plan.
Return on equity, or ROE, declined to 21.01% in FY26 from 45.76% in FY25 and 86.24% in FY24. Return on capital employed, or ROCE, was 22.98% in FY26, after 31.24% in FY25 and 20.71% in FY24. These ratio changes occurred as net worth rose by Rs 117.33 crore and total assets rose by Rs 124.49 crore from FY25 to FY26.
Conclusion
Indo SMC's FY24-to-FY26 figures show simultaneous expansion in sales, earnings, net worth and current assets. Revenue rose by Rs 281.71 crore, PAT increased by Rs 29.38 crore and cash and bank balances grew by Rs 53.28 crore, while the debt-to-equity ratio declined by 2.75 times. The FY26 balance sheet also carried Rs 85.08 crore of inventory, substantially above the FY25 level.
Next, readers should watch Indo SMC's disclosed plan to expand manufacturing capacity in South and North India and its stated focus on defence, automotive, aviation, medical devices and innovative materials. Management also identifies expansion into regional and international markets and distribution-network development as priorities. The presentation provides no dated capacity target, order-book value or funding schedule for these plans.