










Indo SMC income rose 93.61% while EBITDA growth lagged in H1
Key highlights
- Indo SMC reported H1 FY27 total income of Rs 218.0433 crore, up 93.61% year on year.
- EBITDA increased 55.47% to Rs 27.6655 crore in H1 FY27, below total-income growth.
- Profit after tax rose 76.19% to Rs 20.1829 crore in H1 FY27.
- Indo SMC reported an order book of Rs 145 crore as of October 31, 2026.
powered by IRIS
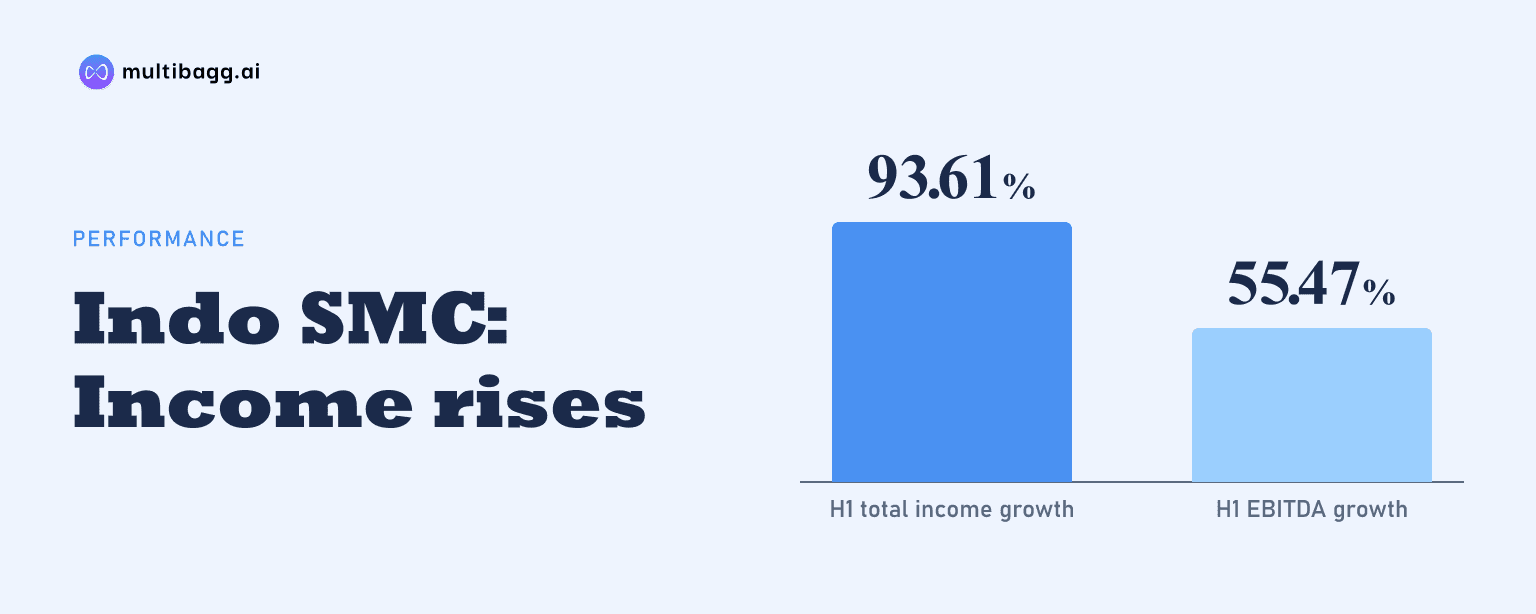
For H1 FY27, Indo SMC Limited reported total income of Rs 218.0433 crore, up 93.61% year on year, while EBITDA increased 55.47% to Rs 27.6655 crore. The different growth rates meant the calculated EBITDA margin declined to 12.69% from 15.80% in H1 FY26, based on the company’s unaudited presentation.
Know Indo SMC inside out
Results, valuation, peers and who's buying, in one view.
How fast did Indo SMC’s H1 FY27 income grow?
Indo SMC’s total income nearly doubled to Rs 218.0433 crore in the first half of financial year 2027 (H1 FY27), from Rs 112.6189 crore in H1 FY26. The Rs 105.4244 crore increase was reported as 93.61% growth, with the detailed profit-and-loss statement describing the measure as total revenue while the highlights page calls it total income.
Revenue from operations rose to Rs 216.1036 crore from Rs 112.5411 crore in H1 FY26. Other income increased to Rs 1.9397 crore from Rs 7.78 lakh, making it a small part of the Rs 218.0433 crore total-income figure. In commentary dated November 5, 2026, management said revenue from operations was also around 10% higher than H2 FY26, although the presentation does not disclose the H2 FY26 base.
Indo SMC’s key-financial-highlights page labels the Rs 218.0433 crore income figure as “H2 FY27,” creating a period-label inconsistency. The detailed statement on the following page identifies the same figure as H1 FY27 and compares it with H1 FY26, while the filing covers the half year ended September 30, 2026. This article uses the detailed statement’s H1 FY27 designation.
Why did Indo SMC’s EBITDA grow slower than income?
Indo SMC’s EBITDA, or earnings before interest, tax, depreciation and amortisation, rose by Rs 9.8702 crore to Rs 27.6655 crore in H1 FY27. Total expenses, however, increased by Rs 95.5542 crore to Rs 190.3778 crore, compared with a Rs 105.4244 crore increase in total income. That arithmetic explains why EBITDA expanded at 55.47%, below the 93.61% total-income growth rate.
Cost of materials consumed was the largest reported expense in both periods, rising to Rs 171.4508 crore from Rs 81.4114 crore. Its Rs 90.0394 crore increase exceeded the combined Rs 5.5148 crore rise in employee-benefit and other expenses. Employee-benefit expense rose to Rs 3.4798 crore from Rs 2.5506 crore, while other expenses increased to Rs 15.4472 crore from Rs 10.8616 crore.
The reported figures imply an EBITDA margin of 12.69% in H1 FY27, against 15.80% in H1 FY26, a decline of about 3.11 percentage points. This is an analysis calculated by dividing EBITDA by total revenue in each period, rather than a margin measure disclosed by Indo SMC. The presentation does not provide a management explanation for the change in material consumption or the margin movement.
Got a follow-up? Ask IRIS
What happened to Indo SMC’s profit after tax?
Indo SMC’s profit after tax, or PAT, rose 76.19% to Rs 20.1829 crore in H1 FY27 from Rs 11.4551 crore a year earlier. Profit before tax increased 74.69% to Rs 24.5168 crore from Rs 14.0348 crore, placing PAT growth above EBITDA growth but below total-income growth during the half year.
Finance expenses declined to Rs 2.2761 crore from Rs 3.1685 crore, a reduction of Rs 0.8924 crore. Depreciation and amortisation increased to Rs 0.8727 crore from Rs 0.5921 crore, and tax expense rose to Rs 4.3339 crore from Rs 2.5798 crore. The lower finance expense accompanied the Rs 10.4820 crore increase in profit before tax.
On a calculated basis, PAT represented 9.26% of total revenue in H1 FY27, compared with 10.17% in H1 FY26. Other income rose to Rs 1.9397 crore from Rs 7.78 lakh, but the presentation does not identify its source. It also does not provide product-level, customer-level or segment-level profit data for the Rs 216.1036 crore of revenue from operations.
What business actions did Indo SMC report during H1 FY27?
Indo SMC said it secured bus-duct and variable-frequency-drive, or VFD, panel orders worth Rs 118.73 crore during H1 FY27. Management also reported the first export shipment of fibre-reinforced-plastic, or FRP, products to Oman and said new pultrusion machines had expanded FRP capacity at its Ahmedabad facility. These actions were presented as part of a plan to broaden products and markets.
Indo SMC operates across three product categories: sheet moulding compound products, FRP products and electrical components. The company reported four manufacturing units across Gujarat, Maharashtra and Rajasthan, more than 300 employees and operations in 20 states. Its order book was Rs 145 crore as of October 31, 2026, one month after the September 30 half-year end.
Management said approvals for 33 kilovolt metering cubicles were under final processing, while a PCVCB panel was planned for launch. It also targeted June 2027 for a ring main unit, or RMU. The presentation cites demand from State Electricity Boards, distribution companies and industrial customers, but does not disclose revenue attributable to those customer groups, the Rs 118.73 crore orders or any individual product category.
Conclusion
The H1 FY27 results show that Indo SMC added Rs 105.4244 crore of total income and Rs 8.7278 crore of PAT from H1 FY26, but operating profit did not rise at the same rate as sales. Materials consumed accounted for Rs 171.4508 crore of H1 FY27 expenses, and the calculated EBITDA margin was 12.69%, compared with 15.80% a year earlier.
The next disclosed operating milestones are the 33 kilovolt metering-cubicle approvals, the planned PCVCB-panel launch and the June 2027 RMU target. Subsequent results will also show whether the Rs 145 crore order book reported on October 31, 2026, including Rs 118.73 crore of bus-duct and VFD-panel orders cited by management, converts into revenue and profit.