










Indus Towers Limited revenue rose while EBITDA margin fell
Key highlights
- Indus Towers’ aligned passive-infrastructure revenue increased 4% to Rs 8,515.6 crore in the quarter ended Sep-26.
- Indus Towers’ aligned EBITDA margin fell 1.7 percentage points to 55.6% in the Sep-26 quarter.
- Indus Towers’ aligned operating free cash flow rose 7% to Rs 2,268.5 crore in Sep-26.
- Indus Towers’ aligned six-month capital expenditure declined 8% to Rs 4,184.1 crore in Sep-26.
powered by IRIS
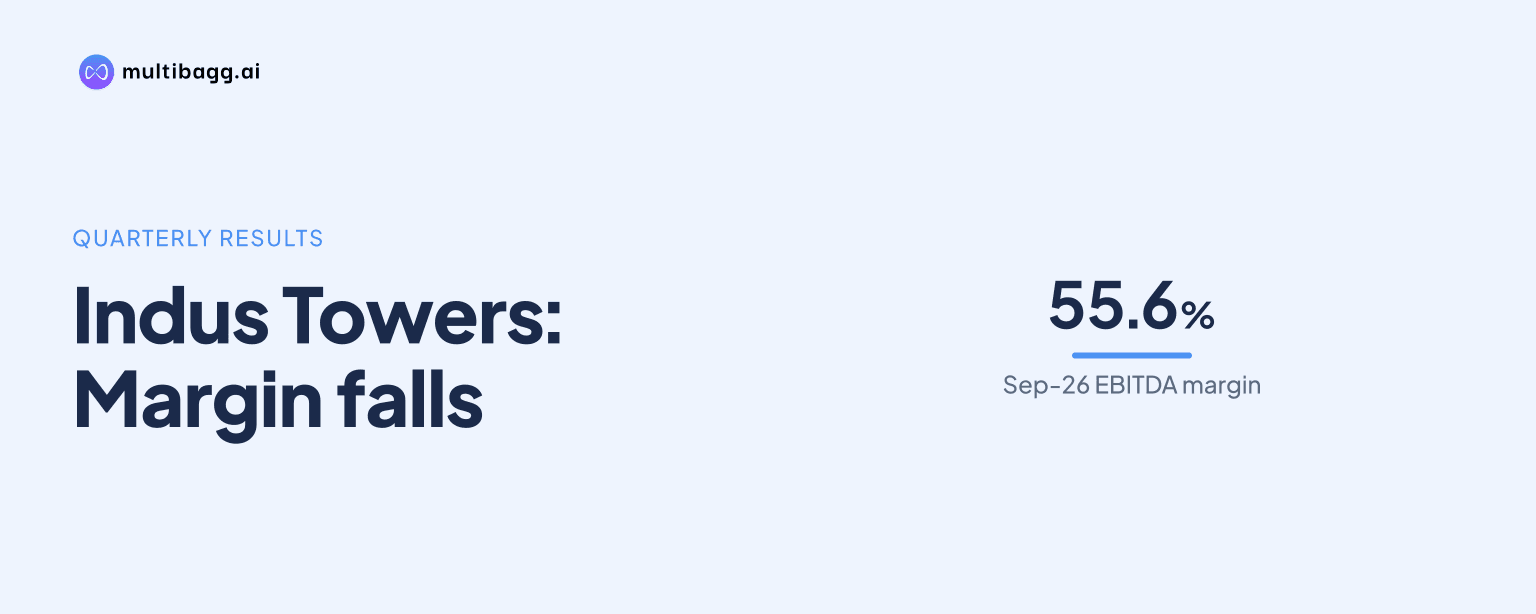
Indus Towers Limited’s aligned passive-infrastructure segment recorded 4% year-on-year revenue growth to Rs 8,515.6 crore in the quarter ended Sep-26, but its EBITDA margin fell 1.7 percentage points to 55.6% as EBITDA increased 1% to Rs 4,738.6 crore. The presentation says these measures differ from Indus Towers’ reported figures.
Know Bharti Airtel inside out
Results, valuation, peers and who's buying, in one view.
How did Indus Towers’ revenue and EBITDA change in Sep-26?
Indus Towers’ aligned passive-infrastructure revenue rose to Rs 8,515.6 crore in the quarter ended Sep-26 from Rs 8,188.3 crore in the quarter ended Sep-25, an increase of 4%. Earnings before interest, tax, depreciation and amortisation, or EBITDA, increased by 1% to Rs 4,738.6 crore from Rs 4,695.2 crore, trailing the revenue growth rate.
For the six months ended Sep-26, Indus Towers reported aligned revenue of Rs 16,946.7 crore, up 4% from Rs 16,245.9 crore in the prior-year period. EBITDA increased 2% to Rs 9,360.6 crore from Rs 9,162.5 crore, again growing more slowly than revenue.
Earnings before interest and tax, or EBIT, moved in the opposite direction to EBITDA, declining 4% to Rs 2,752.1 crore in Sep-26 from Rs 2,853.8 crore a year earlier. The source provides the EBITDA and EBIT results but does not give a line-by-line explanation for the difference between their growth rates.
Why did Indus Towers’ EBITDA margin decline?
Indus Towers’ aligned EBITDA margin declined because quarterly EBITDA grew 1%, compared with 4% revenue growth. The margin was 55.6% in the quarter ended Sep-26, against 57.3% in the quarter ended Sep-25, a reduction of 1.7 percentage points.
The six-month comparison showed the same outcome: EBITDA margin was 55.2% for the six months ended Sep-26, down 1.2 percentage points from 56.4% in the six months ended Sep-25. Revenue rose 4% over the half year while EBITDA grew 2%, leaving the margin below the prior-year level.
The presentation does not disclose a cost-by-cost reason for the margin reduction, such as energy, maintenance, tenancy or employee expenses. It does disclose that the passive-infrastructure segment’s financial measures and associated ratios are different from Indus Towers’ own reported numbers, to align this segment with the presentation’s other businesses.
Got a follow-up? Ask IRIS
How material was Indus Towers within the India and South Asia segment view?
Indus Towers contributed Rs 8,515.6 crore of revenue and Rs 4,738.6 crore of EBITDA before eliminations in the Sep-26 India and South Asia segment view. The segment accounted for 20% of the listed revenue and 18% of the listed EBITDA, while contributing 25% of listed capital expenditure of Rs 2,470.1 crore.
Mobile Services was the largest listed segment, reporting Sep-26 revenue of Rs 30,943.1 crore and EBITDA of Rs 18,873.5 crore. It represented 73% of both listed revenue and EBITDA, compared with Indus Towers’ 20% revenue share and 18% EBITDA share.
The source records eliminations and other adjustments of Rs 6,136 crore from revenue and Rs 1,882.6 crore from EBITDA in the Sep-26 India and South Asia view. Before these eliminations, listed segments generated Rs 48,443.9 crore of revenue and Rs 27,612 crore of EBITDA, which is why segment revenue shares total more than 100%.
What happened to Indus Towers’ capital expenditure and cash flow?
Indus Towers’ aligned capital expenditure declined 4% year on year to Rs 2,470.1 crore in the Sep-26 quarter, from Rs 2,584.5 crore in Sep-25. Operating free cash flow, defined by the presentation as EBITDA less capital expenditure, increased 7% to Rs 2,268.5 crore from Rs 2,110.7 crore.
For the six months ended Sep-26, capital expenditure fell 8% to Rs 4,184.1 crore from Rs 4,537.2 crore in the preceding year. Operating free cash flow rose 12% to Rs 5,176.5 crore from Rs 4,625.3 crore, while cumulative investments reached Rs 1,17,752.6 crore as at Sep 30, 2026, up 5% from Rs 1,11,856.2 crore.
The presentation’s lower capital expenditure alongside higher operating free cash flow is a reported cash-flow comparison, not a statement of future investment policy. The source does not provide a tower count, tower additions, co-location data or a passive-infrastructure revenue-per-tower measure for Indus Towers.
Conclusion
Indus Towers’ aligned passive-infrastructure business added revenue in both reported periods, with Sep-26 quarterly revenue up 4% and half-year revenue also up 4%. However, EBITDA increased by less than revenue in each period, bringing the quarterly margin to 55.6% and the six-month margin to 55.2%, while quarterly EBIT declined 4%.
The next disclosure to watch is whether Indus Towers provides the cost drivers behind its margin movement and additional operating measures on towers or co-locations. The Sep-26 presentation leaves those matters unresolved, although it shows cumulative investments of Rs 1,17,752.6 crore and six-month capital expenditure of Rs 4,184.1 crore.