










Indus Towers-linked revenue rose 4% as EBITDA margin fell
Key highlights
- Indus Towers-linked passive infrastructure revenue was Rs 8,515.6 crore in the quarter ended September 2026, up 4% year on year.
- Indus Towers-linked EBITDA margin was 55.6% in September 2026, down 1.7 percentage points year on year.
- Indus Towers-linked six-month operating free cash flow rose 12% to Rs 5,176.5 crore as capex fell 8%.
- The presentation says its passive-infrastructure figures differ from Indus Towers’ reported financial numbers and ratios.
powered by IRIS
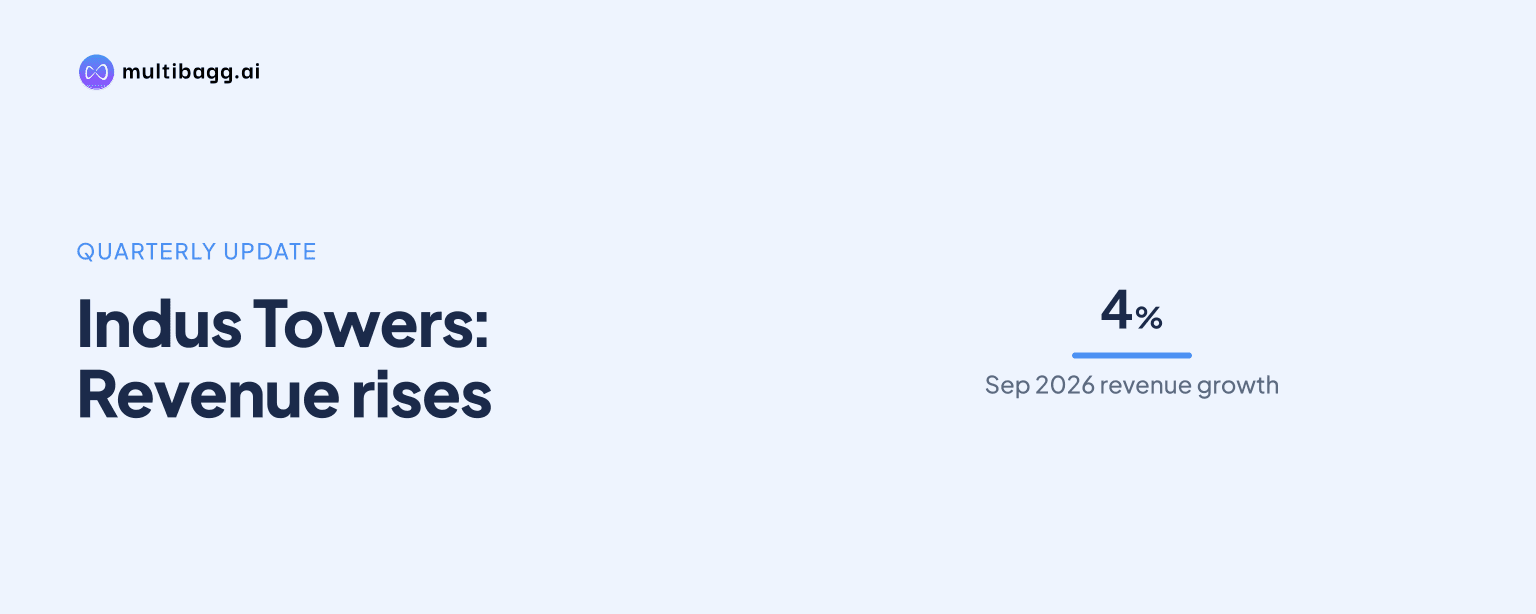
Indus Towers Limited-linked passive infrastructure revenue was Rs 8,515.6 crore in the quarter ended September 2026, up 4% year on year, while EBITDA margin fell 1.7 percentage points to 55.6%. The presentation reports these figures within Bharti Airtel’s Passive Infrastructure Services segment and says they differ from Indus Towers’ reported financial numbers and ratios.
Know Bharti Airtel inside out
Results, valuation, peers and who's buying, in one view.
What did Indus Towers-linked infrastructure revenue and EBITDA show in September 2026?
Indus Towers-linked Passive Infrastructure Services revenue was Rs 8,515.6 crore in the quarter ended September 2026, compared with Rs 8,188.3 crore in the quarter ended September 2025. EBITDA, or earnings before interest, tax, depreciation and amortisation, increased 1% to Rs 4,738.6 crore from Rs 4,695.2 crore. Revenue therefore rose by Rs 327.3 crore, while EBITDA increased by Rs 43.4 crore.
The segment’s operating free cash flow rose 7% to Rs 2,268.5 crore from Rs 2,110.7 crore a year earlier. The presentation defines operating free cash flow as EBITDA less capital expenditure, or capex. Quarterly capex declined 4% to Rs 2,470.1 crore from Rs 2,584.5 crore, a larger percentage movement than the 1% increase in EBITDA.
Why did Indus Towers-linked EBITDA margin decline?
Indus Towers-linked EBITDA margin was 55.6% in the September 2026 quarter, down from 57.3% in September 2025. The resulting 1.7-percentage-point decline occurred while revenue grew 4% and EBITDA grew 1%. This comparison shows that EBITDA increased more slowly than revenue during the quarter.
Earnings before interest and tax, or EBIT, declined 4% to Rs 2,752.1 crore from Rs 2,853.8 crore despite the revenue increase. The presentation does not identify the reason for either the margin reduction or the EBIT decline. It does not attribute the movement to pricing, tenancy, power costs, depreciation, or any other operating factor.
How did Indus Towers-linked infrastructure perform over six months?
Indus Towers-linked revenue for the six months ended September 2026 was Rs 16,946.7 crore, up 4% from Rs 16,245.9 crore in the six months ended September 2025. EBITDA rose 2% to Rs 9,360.6 crore from Rs 9,162.5 crore. The six-month revenue growth rate matched the quarterly rate, while EBITDA growth was one percentage point higher than in the September quarter.
The six-month EBITDA margin was 55.2%, compared with 56.4% a year earlier, a 1.2-percentage-point decline. That reduction was narrower than the 1.7-percentage-point fall in the September quarter. EBIT fell 2% to Rs 5,437.9 crore, whereas operating free cash flow increased 12% to Rs 5,176.5 crore as capex decreased 8% to Rs 4,184.1 crore.
Got a follow-up? Ask IRIS
How large was Indus Towers-linked infrastructure in India and South Asia?
Indus Towers-linked Passive Infrastructure Services represented 20% of revenue and 18% of EBITDA in the September 2026 India and South Asia segment contribution table. Its Rs 8,515.6 crore revenue was below Mobile Services revenue of Rs 30,943.1 crore and above Airtel Business revenue of Rs 5,877.9 crore. The segment’s Rs 2,470.1 crore capex represented 25% of the India and South Asia capex shown in that table.
For the six months ended September 2026, the contribution table calls the category Tower Infrastructure Services. It reported Rs 16,946.7 crore of revenue, or 20% of the India and South Asia subtotal, and Rs 9,360.6 crore of EBITDA, or 19%. Cumulative investments were Rs 1,17,752.6 crore as at September 30, 2026, equal to 20% of cumulative investments in that table.
Does the presentation confirm Indus Towers’ co-location additions and revenue per tower?
No, the supplied September 2026 material does not report macro co-location additions for Indus Towers, including a figure of 24,436. It also does not disclose a tower-sharing revenue-per-tower metric for Indus Towers. The segment note instead says the Passive Infrastructure Services financial numbers and ratios differ from Indus Towers’ reported figures to align them with other segments.
The operating-statistics page reports Mobile Services India revenue per tower per month of Rs 2,93,933 in September 2026, up 7.9% from Rs 2,72,510 in September 2025. That measure appears under Mobile Services India rather than Passive Infrastructure Services. It cannot therefore be used to establish a change in Indus Towers’ tower-sharing revenue per tower.
Conclusion
The September 2026 presentation shows revenue expansion but lower reported profitability ratios for Indus Towers-linked infrastructure activity. Quarterly revenue rose 4% to Rs 8,515.6 crore and operating free cash flow rose 7% to Rs 2,268.5 crore, while EBITDA increased 1% and the EBITDA margin fell to 55.6%. Over six months, revenue also grew 4%, capex fell 8%, and EBITDA margin was 55.2%.
The next disclosure to watch is Indus Towers’ own reported operating and financial data, because Bharti Airtel states that its segment figures differ from Indus Towers’ reported figures. The supplied material sets no target or scheduled event for co-location additions, tenancy, tower-sharing revenue per tower, or margin, leaving those measures unresolved in this presentation.