










Foodlink returned to profit as FY26 EBITDA margin reached 13.82%
Key highlights
- Foodlink reported FY26 revenue from operations of Rs 567.499 crore, up from Rs 450.861 crore in FY25.
- Foodlink's EBITDA margin increased from 8.12% in FY24 to 13.82% in FY26.
- Foodlink's PAT moved from a Rs 15.352 crore loss in FY24 to a Rs 29.107 crore profit in FY26.
- Foodlink catered 1,092 events in FY26, compared with 911 events in FY24.
powered by IRIS
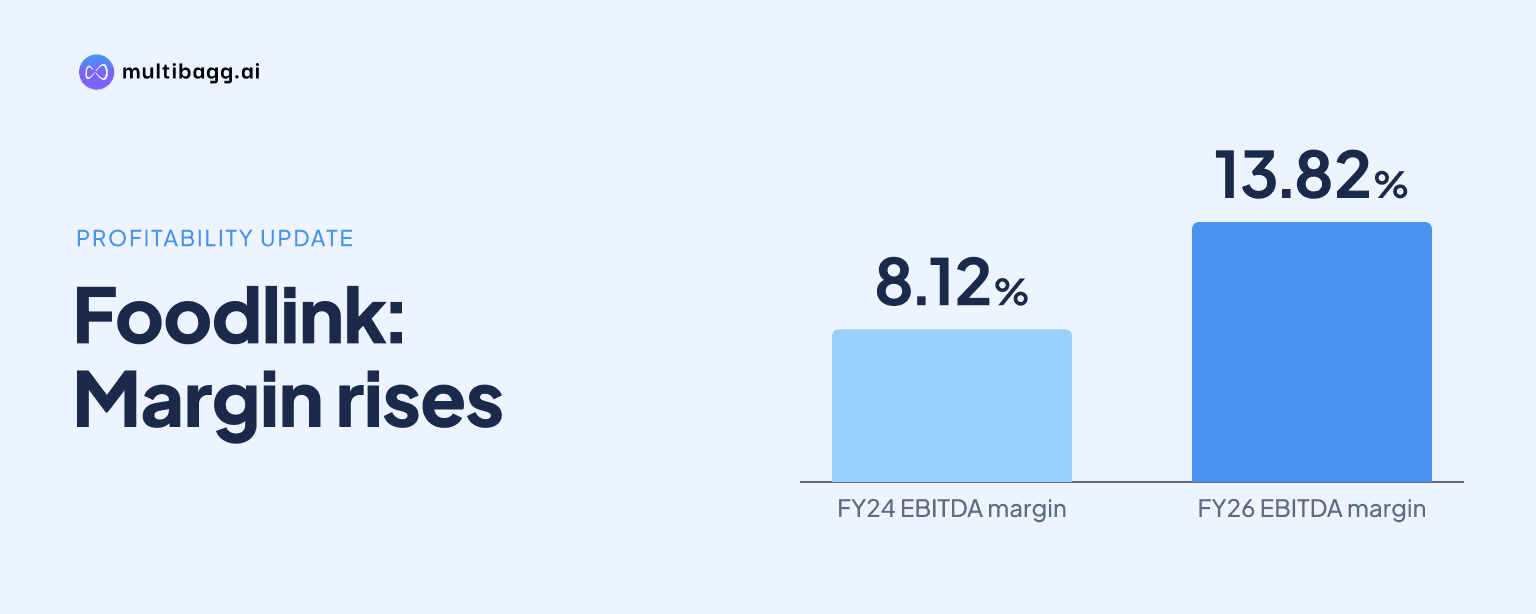
Foodlink F&B Holdings India Limited, referred to as Foodlink, returned to profit in FY25 and reported a 13.82% earnings before interest, tax, depreciation and amortisation (EBITDA) margin in FY26. Foodlink recorded FY26 profit after tax of Rs 29.107 crore on revenue from operations of Rs 567.499 crore, following a Rs 15.352 crore loss in FY24.
How did Foodlink return to profit in FY25?
Foodlink returned to profit in FY25 as profit after tax, or PAT, moved from a Rs 15.352 crore loss in FY24 to a Rs 14.261 crore profit in FY25. PAT in the benchmarking data means profit or loss after tax from continuing operations. Foodlink’s PAT margin, calculated as PAT divided by total income, also changed from negative 4.04% in FY24 to positive 3.13% in FY25.
Foodlink’s FY25 revenue from operations rose to Rs 450.861 crore from Rs 377.193 crore in FY24, while EBITDA increased to Rs 61.449 crore from Rs 30.630 crore. As a result, EBITDA margin rose by 5.51 percentage points to 13.63% in FY25 from 8.12% in FY24. The benchmarking table defines EBITDA as profit before tax, prior-period and exceptional items, plus finance costs, less other income, plus depreciation and amortisation.
The published figures show that the FY25 PAT turnaround coincided with both a Rs 73.668 crore increase in revenue and a doubling of EBITDA. EBITDA is not the same as PAT because it excludes or adjusts for items including finance costs, depreciation, amortisation, other income and tax. Therefore, sustaining net profitability requires Foodlink to retain sufficient operating earnings after those items as well as maintaining revenue growth.
Why did Foodlink's FY26 EBITDA margin reach 13.82%?
Foodlink’s FY26 EBITDA margin reached 13.82% because EBITDA rose to Rs 78.433 crore while revenue from operations increased to Rs 567.499 crore. The FY26 margin was 0.19 percentage points above FY25’s 13.63% and 5.70 percentage points above FY24’s 8.12%. This comparison shows that the largest part of the three-year margin recovery occurred between FY24 and FY25.
Foodlink’s PAT increased to Rs 29.107 crore in FY26 from Rs 14.261 crore in FY25, and PAT margin rose to 5.09% from 3.13%. Revenue increased by Rs 116.638 crore between FY25 and FY26, compared with a Rs 73.668 crore increase between FY24 and FY25. Foodlink therefore reported positive PAT for two consecutive years after the FY24 loss, although the increase in EBITDA margin in FY26 was smaller than in FY25.
The FY26 figures indicate that Foodlink added Rs 16.984 crore of EBITDA on the FY25 revenue base, while its EBITDA margin rose by less than one-quarter of a percentage point. That relationship matters because revenue growth by itself does not ensure a stable margin. The 13.82% FY26 level would depend on Foodlink maintaining the operating-cost-to-revenue relationship reflected in the FY26 benchmark calculation.
Got a follow-up? Ask IRIS
How does Foodlink's FY26 EBITDA margin compare with restaurant peers?
Foodlink’s FY26 EBITDA margin of 13.82% was below the reported margins of Travel Food Services at 39.36%, Specialty Restaurants at 21.22%, Jubilant FoodWorks at 19.85%, Sapphire Foods at 15.37% and Devyani International at 15.24%. Foodlink’s margin was above Westlife Foodworld’s 13.22% and Restaurant Brands Asia’s 12.08% in the same FY26 comparison. Among companies with available FY26 figures, Travel Food Services had the highest reported margin.
The comparison is not like-for-like because Foodlink operates luxury catering, banquets, casual dining restaurants and cloud kitchens, whereas several listed peers are primarily quick-service restaurant operators. The source states that Foodlink has no directly comparable listed entity in India or globally because of its experiential and multi-format business model. In FY25, Foodlink was identified as the largest organised ultra-luxury and luxury catering player among the cited peers by revenue of Rs 343.764 crore.
Foodlink’s margin direction also differed across the comparison set between FY24 and FY26. Foodlink rose from 8.12% to 13.82%, while Devyani International declined from 18.34% to 15.24%, Sapphire Foods fell from 18.19% to 15.37%, and Westlife Foodworld moved from 15.81% to 13.22%. Travel Food Services increased from 29.52% in FY24 to 39.36% in FY26, highlighting the range of outcomes among businesses with different formats and operating models.
What can affect Foodlink's profitability next?
Foodlink’s profitability can be affected by event volumes, restaurant and cloud-kitchen activity, and costs across its three businesses: Events Catering, Casual Dining Restaurants and Cloud Kitchens, and Banquets and Integrated Food and Beverage Services. Foodlink catered 911 events in FY24, 1,012 events in FY25 and 1,092 events in FY26, an increase of 181 events over two years. In the six months ended September 30, 2026, Events Catering handled 402 events.
Foodlink entered casual dining in FY08 and cloud kitchens in FY22, and operates those formats in metropolitan areas and cities in India and the United Arab Emirates. Its Events Catering business has disclosed capacity to serve more than 30,000 guests at a single event and operates internationally, supported by a Dubai storage facility established in FY22. This business mix means Foodlink’s reported FY26 profitability is not solely determined by restaurant operations or by the peer EBITDA margins in the benchmarking table.
The disclosed industry risks identify several conditions that may influence operating results. Weddings account for 70% to 80% of organised catering revenue, with demand concentrated in a limited number of auspicious months. The risk discussion also identifies commodity-price and wage movements, spoilage, rental inflation and hospitality labour attrition, while cloud kitchens can face aggregator commissions of 20% to 25% alongside delivery and packaging costs. These factors can affect the revenue and cost relationship needed to preserve Foodlink’s FY26 EBITDA margin.
Conclusion
Foodlink’s financial benchmarking figures show a shift from a Rs 15.352 crore PAT loss in FY24 to profits of Rs 14.261 crore in FY25 and Rs 29.107 crore in FY26. Over the same period, revenue from operations rose from Rs 377.193 crore to Rs 567.499 crore and EBITDA margin increased from 8.12% to 13.82%. Foodlink’s margin exceeded those of Restaurant Brands Asia and Westlife Foodworld, but remained below several food-service comparators with different business models.
The next measure to watch is whether Foodlink can retain its FY26 margin while pursuing growth in Casual Dining Restaurants and Cloud Kitchens through its restaurant rollout and development process. The source does not disclose a numerical outlet or margin target. Event volumes, particularly in a catering market where weddings account for 70% to 80% of organised revenue, and the effect of food, labour, rent and delivery-platform costs remain the disclosed factors most relevant to that outcome.