










JM Financial Home Loans disbursements rise 48% in Q2FY27
Key highlights
- Home Loans' Q2FY27 disbursements rose 48% year-on-year to Rs 331 crore.
- Home Loans' AUM increased 30% year-on-year to Rs 3,929 crore in Q2FY27.
- Home Loans' spread expanded to 4.8% in Q2FY27 from 4.4% in Q2FY26.
- Home Loans' GNPA and NNPA ratios declined to 1.1% and 0.7%, respectively.
powered by IRIS
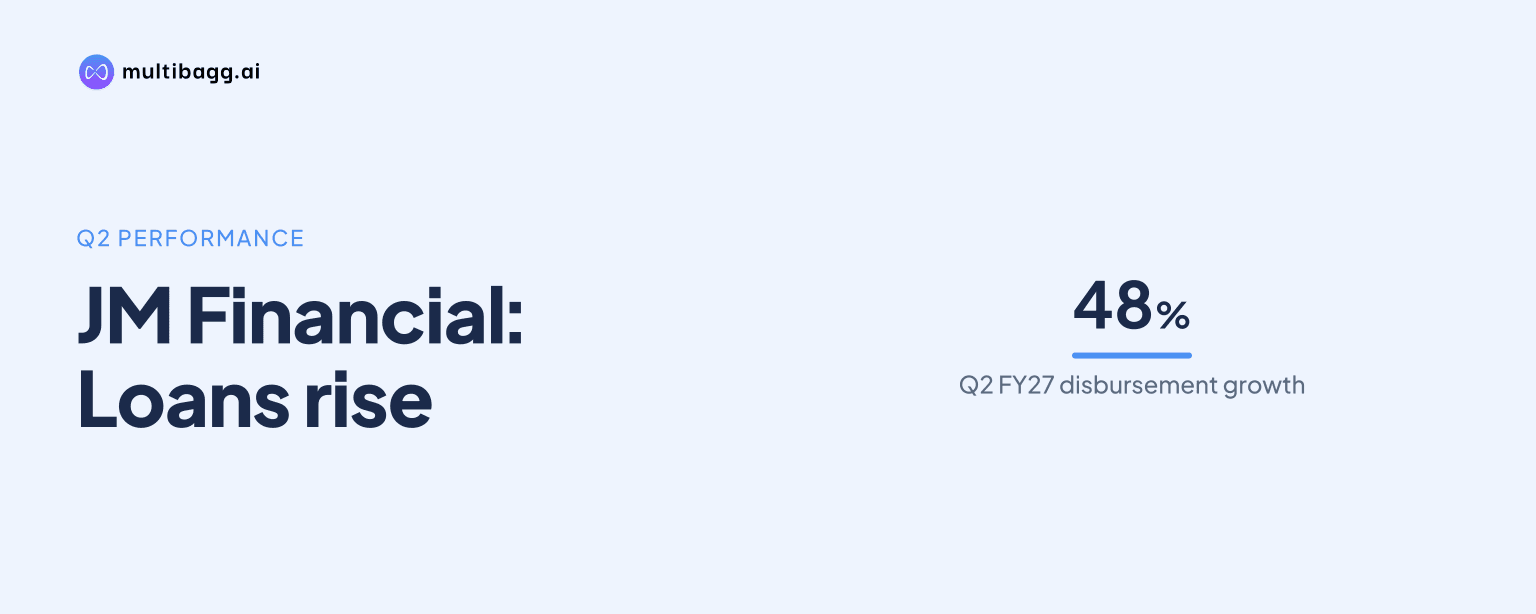
JM Financial Home Loans increased Q2FY27 disbursements 48% year-on-year to Rs 331 crore, while assets under management reached Rs 3,929 crore, spread widened to 4.8% from 4.4%, and gross non-performing assets declined to 1.1% from 1.6%. Operating profit after tax rose 41% to Rs 18 crore.
Know JM Financial inside out
Results, valuation, peers and who's buying, in one view.
How fast did Home Loans grow in Q2FY27?
Home Loans increased Q2FY27 disbursements by 48% to Rs 331 crore from Rs 225 crore in Q2FY26, exceeding its 30% increase in assets under management, or AUM, to Rs 3,929 crore from Rs 3,031 crore. Half-year disbursements were Rs 692 crore, compared with Rs 418 crore in the corresponding half-year figure shown in the presentation.
The faster increase in disbursements than AUM shows that new lending grew more quickly than the outstanding portfolio during the reported comparison. Home Loans also assigned a Rs 175 crore portfolio in Q2FY27, while the on-book share of AUM was 76%, compared with 84% in Q2FY26. The presentation does not disclose the assignment terms or quantify its effect on future on-book AUM growth.
Home Loans serves salaried and self-employed retail customers through home loans and loans against property. Self-employed customers accounted for 57% of the customer base and salaried customers for 43% in Q2FY27. The average ticket size was about Rs 10.5 lakh and the average loan-to-value ratio was 60%, although the presentation does not provide prior-period comparisons for either measure.
Did Home Loans improve asset quality in Q2FY27?
Home Loans reported lower asset-quality ratios in Q2FY27, with gross non-performing assets, or GNPA, declining to 1.1% from 1.6% in Q2FY26 and net non-performing assets, or NNPA, declining to 0.7% from 1.0%. The reported changes were reductions of 0.5 percentage points in GNPA and 0.3 percentage points in NNPA.
The presentation reports those ratios alongside Rs 3,929 crore of AUM and Rs 331 crore of quarterly disbursements, but does not disclose credit costs, provisions, collections or overdue-loan buckets. It therefore establishes a lower reported GNPA and NNPA ratio without providing enough detail to calculate impaired loan values or identify the contributors to the change.
Home Loans disclosed an average loan-to-value ratio of 60% and said its priorities include technology-driven sourcing, monitoring and client servicing. Management also identified building scale, improving productivity and deeper penetration in existing geographies as business priorities. The presentation provides no numerical target for lending growth, asset quality, branches or productivity.
Why did Home Loans' spread rise to 4.8%?
Home Loans' spread increased to 4.8% in Q2FY27 because its reported yield was 13.1% and its cost of funds fell to 8.3%. In Q2FY26, yield was 13.0% and cost of funds was 8.6%, producing a spread of 4.4%. The disclosed 0.4-percentage-point expansion coincided with a 0.3-percentage-point fall in funding cost and a 0.1-percentage-point increase in yield.
The spread rose in each of the five reported quarters, from 4.4% in Q2FY26 to 4.5% in Q3FY26, 4.6% in Q4FY26, 4.7% in Q1FY27 and 4.8% in Q2FY27. Yield remained in a narrow 13.0% to 13.1% range over that period, while cost of funds declined from 8.6% to 8.3%, making the lower funding cost the principal disclosed movement behind the spread increase.
Home Loans had borrowings outstanding of Rs 2,196 crore in Q2FY27. Banks and financial institutions provided 59% of the liability profile, the National Housing Bank category accounted for 20%, mutual funds for 18% and other sources for 3%. The presentation does not disclose the cost of borrowing, maturity or repayment profile by funding source.
Got a follow-up? Ask IRIS
How did Home Loans translate lending growth into earnings?
Home Loans increased Q2FY27 revenue 22% to Rs 133 crore from Rs 109 crore and operating profit after tax 41% to Rs 18 crore from Rs 13 crore. Operating profit before tax rose 45% to Rs 26 crore from Rs 18 crore. The faster increase in operating profit than revenue coincided with the reported expansion in spread, although the presentation does not provide an expense bridge.
For H1FY27, Home Loans reported revenue of Rs 256 crore, compared with Rs 210 crore in H1FY26, and operating profit after tax of Rs 35 crore, compared with Rs 27 crore. Management reported FY24 to FY26 compound annual growth rates of 37% for revenue, 66% for operating profit before tax and 76% for operating profit after tax. FY26 profit figures were adjusted for the statutory impact of new labour codes.
Home Loans' Q2FY27 segment revenue of Rs 133 crore rose while JM Financial's total consolidated revenue increased 1.1% to Rs 1,056 crore. Its segment profit after tax of Rs 18 crore increased while total consolidated profit after tax declined 11.3% to Rs 240 crore. The segment's revenue and profit direction therefore differed from the group's consolidated profit movement in the quarter.
What operating footprint supports Home Loans' growth?
Home Loans operated 152 branches across nine states in Q2FY27, up by 18 branches from 134 in Q2FY26, and had 2,488 employees. Gujarat accounted for 26% of branches, Maharashtra 22%, Tamil Nadu 14%, Telangana 12% and Madhya Pradesh 10%.
The remaining 16% of the 152-branch network was across Andhra Pradesh, Rajasthan, Karnataka and Chhattisgarh. The branch expansion accompanied Rs 331 crore of Q2FY27 disbursements and a customer base in which self-employed borrowers represented 57%. Management's plan is to further penetrate existing geographies and use technology for sourcing, monitoring and client servicing, but it disclosed no branch-addition timetable or disbursement target.
Conclusion
Home Loans combined higher quarterly disbursements, AUM growth, a widening reported spread and lower reported GNPA and NNPA ratios in Q2FY27. Disbursements increased 48% to Rs 331 crore, AUM rose 30% to Rs 3,929 crore, spread reached 4.8% and operating profit after tax increased 41% to Rs 18 crore, while consolidated group profit moved lower year-on-year.
The next reported indicators are whether management's existing-geography penetration and technology-led sourcing plans sustain lending growth, and whether the cost of funds remains below the 8.6% reported in Q2FY26. The presentation also leaves unresolved how the Rs 175 crore portfolio assignment and the lower 76% on-book AUM share will affect the composition of future portfolio growth.