










Jupiter Wagons Q2 EBITDA Margin Rebounds as H1 Profit Falls
Key highlights
- Jupiter Wagons’ Q2 FY27 consolidated EBITDA margin increased 250 basis points sequentially to 12.2%.
- Jupiter Wagons’ Q2 FY27 consolidated EBITDA rose 45.2% sequentially to Rs 94.3 crore.
- Jupiter Wagons’ H1 FY27 consolidated revenue increased 15.9% year-on-year to Rs 1,442.9 crore.
- Jupiter Wagons’ H1 FY27 consolidated PAT declined 5.3% year-on-year to Rs 72.3 crore.
powered by IRIS
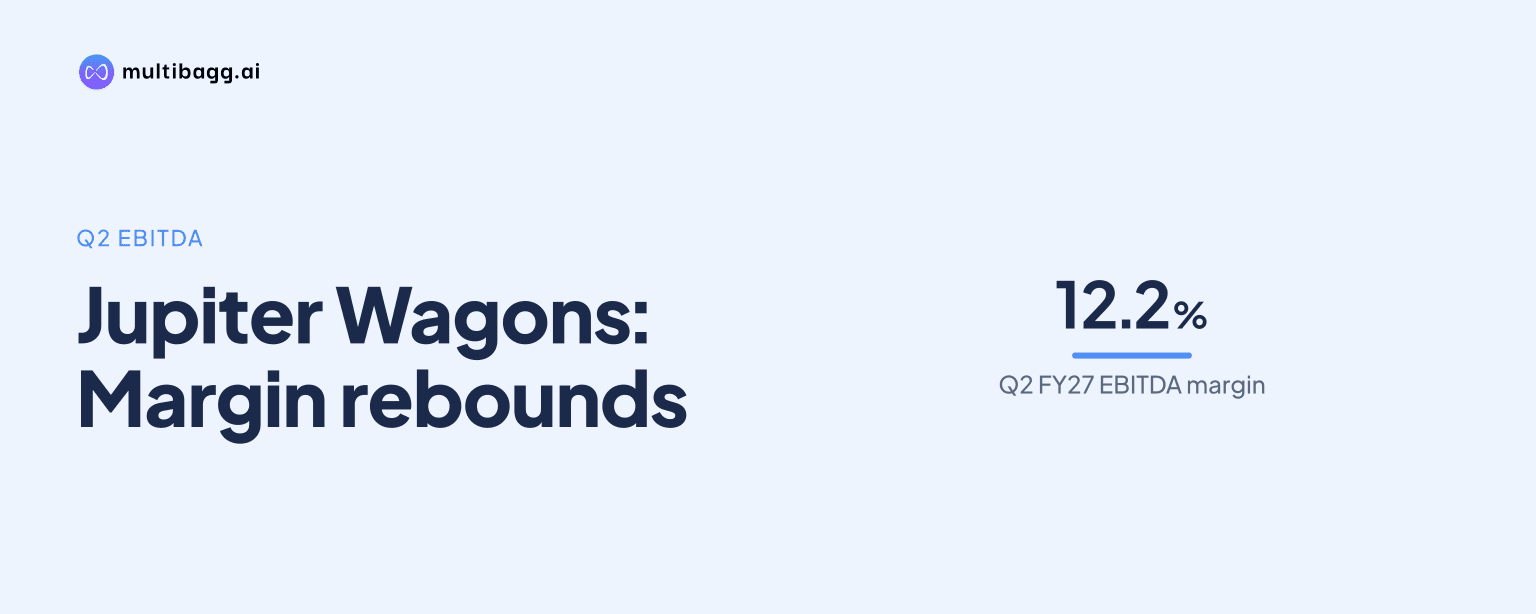
Jupiter Wagons Limited reported a consolidated EBITDA margin of 12.2% in Q2 FY27, up 250 basis points from Q1 FY27, as EBITDA rose 45.2% sequentially to Rs 94.3 crore; however, H1 FY27 profit after tax declined 5.3% year-on-year to Rs 72.3 crore.
Know Jupiter Wagons inside out
Results, valuation, peers and who's buying, in one view.
How did Jupiter Wagons’ Q2 FY27 profitability change sequentially?
Jupiter Wagons’ consolidated operating profitability recovered sequentially in Q2 FY27, with revenue rising 15.1% to Rs 772.2 crore from Rs 670.7 crore in Q1 FY27, while EBITDA, excluding other income, increased 45.2% to Rs 94.3 crore from Rs 64.9 crore. The resulting EBITDA margin rose to 12.2% from 9.7%, a 250-basis-point improvement. A basis point is one-hundredth of a percentage point.
The improvement reflected operating costs increasing more slowly than revenue during Q2 FY27. Total operating cost rose 11.9% sequentially to Rs 677.9 crore, compared with the 15.1% increase in revenue. Raw-material cost rose 12.5% to Rs 555 crore, employee cost was broadly unchanged at Rs 26.1 crore, and other expenses increased 12.3% to Rs 96.8 crore.
Profit after tax, or PAT, rose 76.3% sequentially to Rs 46.2 crore in Q2 FY27 from Rs 26.2 crore in Q1 FY27. Profit before tax increased 68.3% to Rs 65.1 crore, while tax expense rose 51.7% to Rs 18.9 crore. PAT margin increased to 6% from 3.9%, a 210-basis-point sequential rise, and earnings per share were Rs 1.12 on a Rs 10 face-value share.
How did Jupiter Wagons’ Q2 FY27 compare with the prior-year quarter?
Jupiter Wagons’ Q2 FY27 revenue was 1.7% lower year-on-year at Rs 772.2 crore, compared with Rs 785.8 crore in Q2 FY26, and EBITDA declined 9% to Rs 94.3 crore from Rs 103.6 crore. EBITDA margin was 12.2%, down 100 basis points from 13.2% a year earlier, meaning the sequential recovery did not return the business to the prior-year quarterly margin.
Operating-cost movement differed from the revenue trend in the year-on-year comparison. Total operating cost fell 0.6% to Rs 677.9 crore from Rs 682.3 crore, while raw-material cost declined 2.6% to Rs 555 crore. Employee cost nevertheless increased 10.6% to Rs 26.1 crore and other expenses rose 8.7% to Rs 96.8 crore, against the 1.7% fall in revenue.
Despite lower operating profit, Q2 FY27 PAT was 1.8% higher year-on-year at Rs 46.2 crore versus Rs 45.3 crore. The comparison includes an exceptional item of Rs 10.4 crore in Q2 FY26, while Jupiter Wagons reported no exceptional item in Q2 FY27. Profit before tax, before this line item, fell 16.8% to Rs 65.1 crore, and finance cost increased 14.5% to Rs 21.3 crore.
Got a follow-up? Ask IRIS
Why did Jupiter Wagons’ H1 FY27 profit fall despite revenue growth?
Jupiter Wagons’ H1 FY27 consolidated revenue grew 15.9% year-on-year to Rs 1,442.9 crore from Rs 1,245.2 crore, but EBITDA fell 2.6% to Rs 159.2 crore from Rs 163.4 crore. Accordingly, EBITDA margin declined to 11% from 13.1%, a 210-basis-point reduction. This first-half outcome incorporates Q1 FY27’s 9.7% EBITDA margin alongside the Q2 recovery.
Costs increased faster than sales over the six-month period. Total operating cost rose 18.7% to Rs 1,283.8 crore, exceeding revenue growth of 15.9%. Raw-material cost increased 20.9% to Rs 1,048.6 crore, employee cost rose 10.6% to Rs 52.1 crore and other expenses increased 9.6% to Rs 183.1 crore.
PAT declined 5.3% to Rs 72.3 crore in H1 FY27 from Rs 76.4 crore in 6M FY26, while PAT margin reduced to 5% from 6.1%. Profit before tax fell 15.1% to Rs 103.8 crore, and finance cost increased 12.3% to Rs 38.8 crore. The first-half comparison also contains the Rs 10.4 crore exceptional item recorded in 6M FY26 and none in H1 FY27.
What balance-sheet changes accompanied Jupiter Wagons’ first-half results?
Jupiter Wagons’ consolidated total assets rose to Rs 5,901.4 crore at September 2026 from Rs 4,712.5 crore at FY26. The largest movement was capital work in progress, which increased to Rs 1,385.7 crore from Rs 269.6 crore. Non-current assets consequently rose to Rs 3,062 crore from Rs 2,003.4 crore.
Cash and cash equivalents increased to Rs 652 crore at September 2026 from Rs 442.1 crore at FY26, while inventories declined to Rs 1,035.3 crore from Rs 1,078.6 crore and trade receivables fell to Rs 692.8 crore from Rs 756.7 crore. Current assets increased to Rs 2,839.4 crore from Rs 2,709 crore despite the reductions in those two working-capital lines.
Total equity stood at Rs 3,334.2 crore at September 2026, compared with Rs 2,986.6 crore at FY26. Non-current borrowings increased to Rs 881.2 crore from Rs 255.3 crore, while current borrowings were Rs 690.5 crore versus Rs 682.4 crore. The presentation reports total equity and liabilities of Rs 5,901.4 crore, matching total assets.
Conclusion
Jupiter Wagons’ Q2 FY27 results show a sequential improvement in operating performance, with revenue rising 15.1%, EBITDA increasing 45.2% and EBITDA margin gaining 250 basis points to 12.2%. The H1 FY27 comparison remained lower on profitability: EBITDA fell 2.6%, margin declined 210 basis points and PAT decreased 5.3%, despite revenue growth of 15.9%.
The presentation does not disclose a future margin target, capital-spending plan or scheduled event after the September 2026 results. The unresolved items indicated by the reported numbers are whether operating costs, including the 20.9% H1 rise in raw-material cost, and finance cost, up 12.3% to Rs 38.8 crore, change alongside capital work in progress of Rs 1,385.7 crore and non-current borrowings of Rs 881.2 crore.