










Kalyan ROCE reaches 30.7% as non-GML debt turns negative
Key highlights
- Kalyan reported consolidated ROCE of 30.7% in the trailing 12 months, versus 28.8% in FY26.
- Consolidated net debt to equity excluding GML was negative 0.12 times in the trailing 12 months, versus negative 0.05 times in FY26.
- Consolidated inventory turnover rose to 3.3 times in the trailing 12 months from 2.8 times in FY25.
- Net debt to equity including GML declined to 0.4 times in the trailing 12 months from 0.5 times in FY25.
powered by IRIS
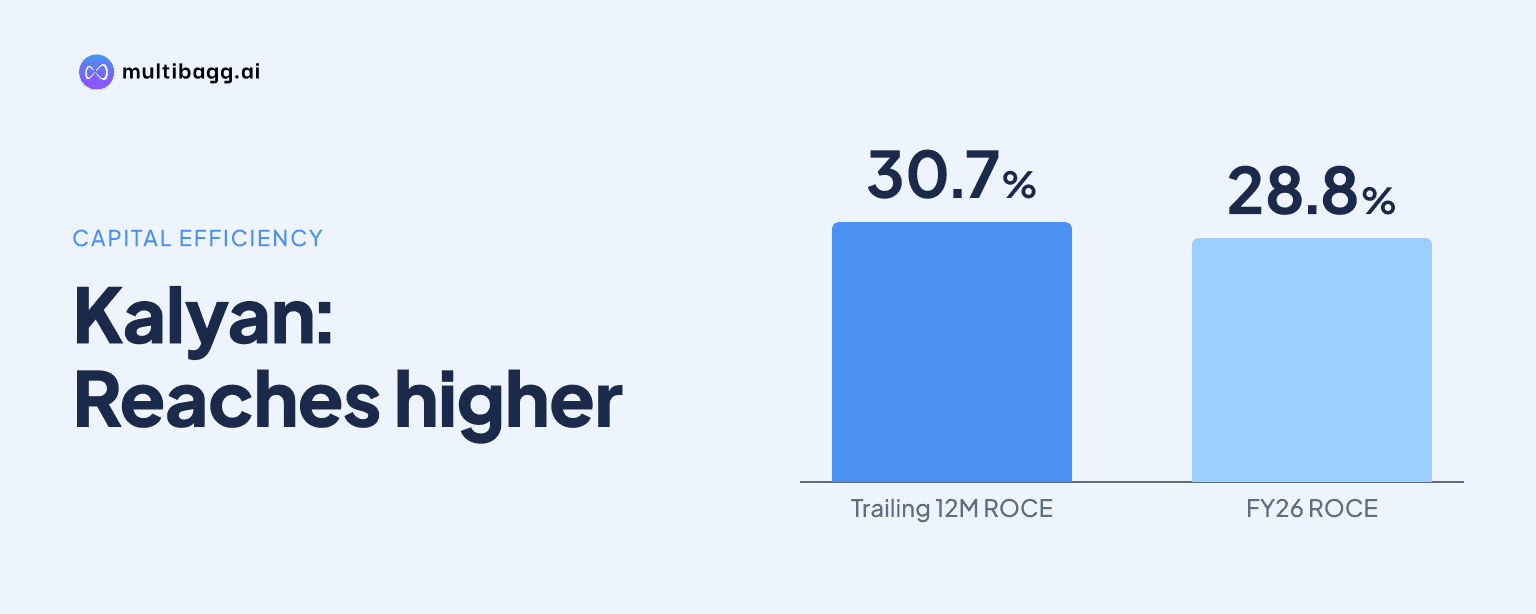
Kalyan Jewellers reported consolidated return on capital employed of 30.7% in the trailing 12 months, while its net-debt-to-equity ratio excluding gold metal loans was negative 0.12 times, compared with negative 0.05 times in FY26. Kalyan’s reported return profile also included inventory turnover of 3.3 times, up from 2.8 times in FY25.
Know Kalyan Jewellers India inside out
Results, valuation, peers and who's buying, in one view.
What did Kalyan report on debt and returns?
Kalyan reported consolidated return on capital employed, or ROCE, of 30.7% in the trailing 12 months, up from 28.8% in FY26 and 19.8% in FY25. Consolidated return on equity, or ROE, increased to 26.7% from 24.3% in FY26 and 15.9% in FY25. The presentation defines ROCE as earnings before interest and tax, or EBIT, divided by average equity, average net debt excluding gold metal loans, or GML, and average lease liabilities.
Kalyan’s consolidated net-debt-to-equity ratio excluding GML was negative 0.12 times in the trailing 12 months, compared with negative 0.05 times in FY26 and negative 0.02 times in FY25. Under the company’s definition, this calculation starts with current and non-current borrowings and deducts cash and cash equivalents plus bank balances other than cash and cash equivalents. Metal gold loans are not included in that version of net debt.
How did Kalyan’s revenue and profit change before ROCE rose?
Kalyan’s trailing-12-month revenue was Rs 41,520 crore, compared with Rs 35,740 crore in FY26 and Rs 25,050 crore in FY25. Earnings before interest, tax, depreciation and amortisation, or EBITDA, reached Rs 2,763.1 crore in the trailing 12 months, against Rs 2,491.2 crore in FY26 and Rs 1,517.2 crore in FY25. EBITDA margin was 6.7%, below 7.0% in FY26 but above 6.1% in FY25.
Trailing-12-month profit after tax, or PAT, rose to Rs 1,601.6 crore from Rs 1,350.4 crore in FY26 and Rs 714.2 crore in FY25. PAT margin was 3.9%, compared with 3.8% and 2.9%, respectively. Kalyan said trailing-12-month PAT represented a 45% compound annual growth rate from FY20, while the FY25 historical figure used adjusted PAT that incorporates the tax-adjusted effect of a one-time exceptional write-off.
ROCE and ROE use different measures of capital and earnings. Kalyan calculates ROE as PAT divided by average equity, producing 26.7% in the trailing 12 months. Its 30.7% ROCE instead uses EBIT and includes average lease liabilities and average net debt excluding GML in the denominator, meaning the two percentages are not directly interchangeable.
What does Kalyan’s negative non-GML debt ratio mean?
Kalyan’s negative 0.12-times consolidated net-debt-to-equity ratio indicates that net debt excluding GML was below zero under its stated trailing-12-month calculation. The measure deducts cash and specified bank balances from current and non-current borrowings. It does not include metal gold loans, which Kalyan presents separately in its including-GML leverage measures.
Including GML, Kalyan’s consolidated net debt to equity was 0.4 times in the trailing 12 months, down from 0.5 times in both FY25 and FY26. Consolidated net debt to EBITDA including GML declined to 1.0 time from 1.3 times in FY26 and 1.5 times in FY25. The difference is material to the company’s reported framework because its ROCE calculation also excludes GML from average net debt.
Kalyan’s India business recorded the same directional shift. India net debt to equity including GML declined from 0.3 times in FY25 and 0.2 times in FY26 to 0.1 times in the trailing 12 months. Excluding GML, India moved from positive 0.10 times in FY25 to negative 0.03 times in FY26 and negative 0.10 times in the trailing 12 months.
Got a follow-up? Ask IRIS
How did Kalyan’s inventory turns compare across the group and India?
Kalyan’s consolidated inventory turn increased to 3.3 times in the trailing 12 months from 3.0 times in FY26 and 2.8 times in FY25. The company defines inventory turn as revenue from operations divided by average inventory. The improvement occurred alongside trailing-12-month revenue of Rs 41,520 crore, compared with Rs 35,740 crore in FY26.
India recorded inventory turn of 3.8 times in the trailing 12 months, above the consolidated 3.3 times and FY26’s 3.4 times. India ROCE was 27.7%, up from 26.1% in FY26 and 17.4% in FY25, while India ROE rose to 25.9% from 23.6% and 15.4%. India’s 25.9% ROE remained below consolidated ROE of 26.7%.
The including-GML debt-service ratios also differed between India and the group. India net debt to EBITDA including GML declined to 0.2 times in the trailing 12 months from 0.5 times in FY26 and 1.0 time in FY25. Consolidated net debt to EBITDA including GML was 1.0 time in the trailing 12 months, compared with 1.3 times in FY26.
What is Kalyan planning to support its return profile?
Kalyan says its franchisee-owned company-operated, or FOCO, showroom model is helping increase the pace of expansion in India through a more capital-efficient and return-accretive path. The presentation does not disclose a store-opening target on these balance-sheet pages. Management identifies FOCO as a mechanism intended to provide a further lift to the return profile.
Kalyan also says discussions are under way with potential investors in the Middle East for a larger FOCO partnership. The presentation identifies the matter as a discussion rather than a completed transaction. In Q2FY27, the Middle East had 38 showrooms, revenue of Rs 961.3 crore and PAT of Rs 12.2 crore, while revenue rose 11% year on year and PAT declined 19%.
Conclusion
Kalyan’s trailing-12-month figures show higher reported returns, faster inventory turnover and lower leverage ratios than FY25. Consolidated ROCE rose by 10.9 percentage points to 30.7%, inventory turn increased from 2.8 to 3.3 times, and net debt to equity excluding GML moved from negative 0.02 to negative 0.12 times. Leverage including GML nevertheless remained positive at 0.4 times of equity.
The next disclosed development to watch is management’s FOCO expansion approach in India and its discussions with potential Middle East investors for a larger FOCO partnership. The presentation also leaves open whether the Middle East business, where Q2FY27 PAT was Rs 12.2 crore, will improve alongside any partnership outcome.