










Kamdhenu Colour and Coatings Limited revenue and EBITDA margin retreat
Key highlights
- Kamdhenu Paints’ FY26 revenue fell to Rs 245.3 crore from the FY24 peak of Rs 291.7 crore.
- Gross profit declined to Rs 103.1 crore in FY26 from Rs 131.9 crore in FY24, while gross-profit margin fell to 42.0% from 45.2%.
- FY26 EBITDA declined to Rs 9.5 crore and EBITDA margin fell to 3.9%, compared with Rs 22.4 crore and 7.7% in FY24.
- H1 FY27 EBITDA was a loss of Rs 0.6 crore, compared with a profit of Rs 7.4 crore in H1 FY26, while H1 FY27 profit after tax was a loss of Rs 5.8 crore.
powered by IRIS
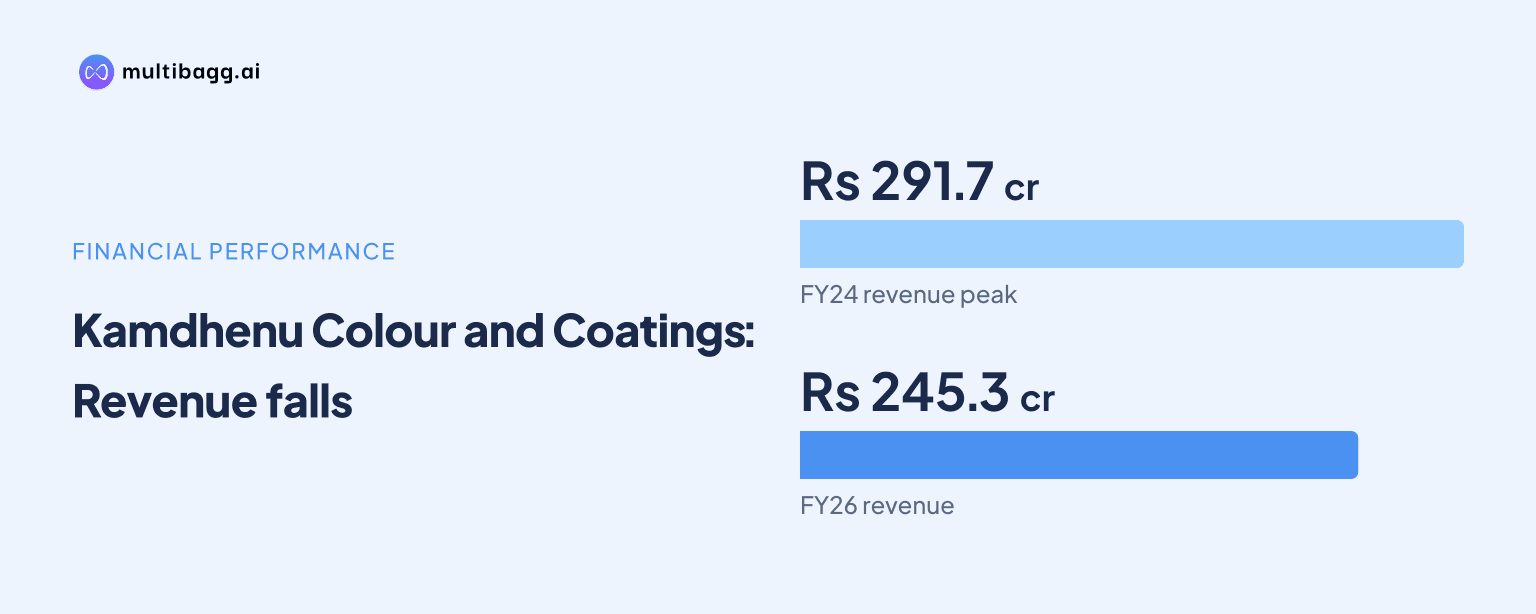
Kamdhenu Colour and Coatings Limited, called Kamdhenu Paints in this article, recorded revenue of Rs 245.3 crore in FY26, down from Rs 291.7 crore in FY24, while earnings before interest, tax, depreciation and amortisation (EBITDA) margin declined to 3.9% from 7.7%. Gross profit, operating profit and profit after tax also fell from their FY24 levels.
Know Kamdhenu Ventures inside out
Results, valuation, peers and who's buying, in one view.
What happened to Kamdhenu Paints revenue after FY24?
Kamdhenu Paints’ revenue declined for two consecutive years after FY24, falling from Rs 291.7 crore to Rs 266.1 crore in FY25 and Rs 245.3 crore in FY26. FY26 revenue was Rs 46.4 crore below the FY24 peak, although it remained Rs 3.9 crore above the Rs 241.4 crore reported in FY22. The figures cover the consolidated paints business.
The post-FY24 movement followed two years of growth. Revenue increased from Rs 241.4 crore in FY22 to Rs 259.5 crore in FY23, then reached Rs 291.7 crore in FY24. FY25 revenue was Rs 25.6 crore below FY24, and the FY26 result was a further Rs 20.8 crore lower than FY25, making FY24 the high point in the five-year series.
How did Kamdhenu Paints gross profit change after FY24?
Kamdhenu Paints’ gross profit fell in each year after FY24, from Rs 131.9 crore in FY24 to Rs 117.3 crore in FY25 and Rs 103.1 crore in FY26. Gross-profit margin declined from 45.2% in FY24 to 44.1% in FY25 and 42.0% in FY26, a 3.2-percentage-point reduction over two years.
Total raw-material cost also decreased, from Rs 159.8 crore in FY24 to Rs 148.8 crore in FY25 and Rs 142.1 crore in FY26. That Rs 17.7 crore reduction was smaller than the Rs 28.8 crore decline in gross profit, while revenue fell by Rs 46.4 crore between FY24 and FY26. The resulting margin movement shows that gross profit declined faster than sales over the period.
Why did Kamdhenu Paints EBITDA margin fall to 3.9%?
Kamdhenu Paints’ EBITDA margin fell to 3.9% in FY26 as EBITDA declined to Rs 9.5 crore from Rs 22.4 crore in FY24. EBITDA was Rs 16.8 crore in FY25, equal to a 6.3% margin, before falling by a further Rs 7.3 crore in FY26. The FY26 margin was 3.8 percentage points below the FY24 level.
The reported expense movement shows lower gross profit alongside higher employee cost. Employee expenses rose from Rs 31.4 crore in FY24 to Rs 33.6 crore in FY25 and Rs 37.8 crore in FY26, an increase of Rs 6.4 crore over two years. Other expenses declined from Rs 78.1 crore in FY24 to Rs 55.9 crore in FY26, but gross profit fell by Rs 28.8 crore over the same period, accompanying the Rs 12.9 crore reduction in EBITDA.
Got a follow-up? Ask IRIS
How far did Kamdhenu Paints operating and net profit fall from FY24?
Kamdhenu Paints’ earnings before interest and tax (EBIT) fell from Rs 18.6 crore in FY24 to Rs 12.2 crore in FY25 and Rs 4.5 crore in FY26. EBIT margin moved from 6.4% in FY24 to 4.6% in FY25 and 1.8% in FY26. Depreciation increased from Rs 4.6 crore in FY24 to Rs 5.9 crore in FY26.
Profit before tax declined from Rs 15.9 crore in FY24 to Rs 9.2 crore in FY25 and Rs 0.5 crore in FY26. Finance cost rose from Rs 2.7 crore in FY24 to Rs 3.9 crore in FY26, while the profit-before-tax margin reduced from 5.5% to 0.2%. Profit after tax followed the same direction, declining from Rs 13.9 crore in FY24 to Rs 6.7 crore in FY25 and Rs 0.2 crore in FY26.
What does Kamdhenu Paints’ five-year record and latest half-year result show?
Kamdhenu Paints’ FY24 performance was substantially above FY22 and FY23, although FY26 remained profitable at the EBITDA level. EBITDA was Rs 3.2 crore in FY22 and negative Rs 0.5 crore in FY23, before reaching Rs 22.4 crore in FY24. The FY26 EBITDA of Rs 9.5 crore was Rs 9.0 crore above FY22 and Rs 10.0 crore above FY23, but below the FY24 and FY25 amounts.
The balance sheet shows total equity increased from Rs 159.4 crore in March 2024 to Rs 178.7 crore in March 2026. Trade receivables rose from Rs 143.9 crore to Rs 147.0 crore across those dates, while inventory declined from Rs 65.5 crore to Rs 56.0 crore. Current borrowings increased from Rs 19.7 crore in March 2024 to Rs 24.7 crore in March 2026, and non-current borrowings rose from nil to Rs 2.2 crore.
The latest reported interim figures show a mixed revenue and profit outcome. Revenue was Rs 103.5 crore in H1 FY27, compared with Rs 107.0 crore in H1 FY26, while gross-profit margin declined to 42.7% from 45.7%. EBITDA changed from a Rs 7.4 crore profit in H1 FY26 to a Rs 0.6 crore loss in H1 FY27, and profit after tax changed from a Rs 2.2 crore profit to a Rs 5.8 crore loss.
Conclusion
Kamdhenu Paints’ five-year record identifies FY24 as the recent peak for revenue, gross-profit margin and EBITDA margin. Revenue declined by Rs 46.4 crore by FY26, gross profit reduced by Rs 28.8 crore, and EBITDA declined by Rs 12.9 crore. Higher employee expenses and lower gross profit accompanied the contraction in operating and net profitability.
The presentation does not disclose a full-year revenue, margin or profit target, or a stated cause for the post-FY24 sales decline. The unresolved issue to watch is whether the business can reverse the H1 FY27 trend, when revenue was Rs 103.5 crore and EBITDA was negative Rs 0.6 crore, compared with revenue of Rs 107.0 crore and EBITDA of Rs 7.4 crore in H1 FY26.