










Kamdhenu Ventures reports Rs 5.9 crore H1 loss and cash outflow
Key highlights
- Kamdhenu Ventures reported a Rs 5.9 crore net loss in H1 FY27, compared with a Rs 1.9 crore profit a year earlier.
- Gross profit fell 10% to Rs 44.2 crore, while gross-profit margin narrowed to 42.3% from 45.7%.
- Inventories increased by Rs 27 crore to Rs 83 crore at September 2026, while trade payables rose to Rs 69.5 crore from Rs 53.3 crore.
- Total assets increased to Rs 301.2 crore at September 2026 from Rs 286.6 crore at March 2026, while total equity declined to Rs 172.9 crore from Rs 178.7 crore.
powered by IRIS
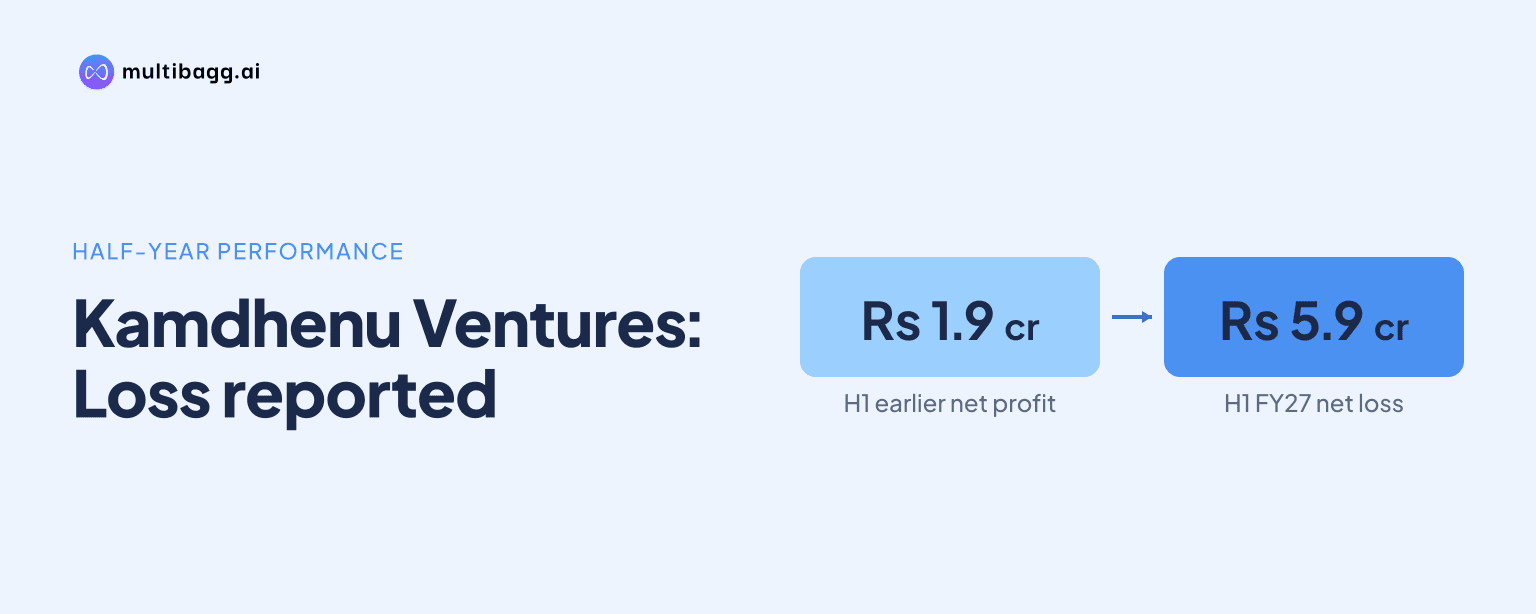
Kamdhenu Ventures Limited reported a consolidated Rs 5.9 crore net loss in H1 FY27, against a Rs 1.9 crore profit a year earlier, as revenue slipped 2% to Rs 104.4 crore. Kamdhenu Ventures’ earnings before interest, tax, depreciation and amortisation (EBITDA) moved from a Rs 7 crore profit to a Rs 90 lakh loss, while net operating cash flow fell to minus Rs 12 crore.
Know Kamdhenu Ventures inside out
Results, valuation, peers and who's buying, in one view.
What caused Kamdhenu Ventures’ H1 FY27 loss?
Kamdhenu Ventures’ H1 FY27 loss resulted from lower gross profit and higher employee expenses despite a relatively limited decline in revenue. Revenue from operations decreased to Rs 104.4 crore from Rs 107 crore in H1 FY26, while gross profit fell 10% to Rs 44.2 crore from Rs 48.9 crore. Gross-profit margin narrowed to 42.3% from 45.7%.
Total raw-material costs rose to Rs 60.2 crore from Rs 58.1 crore, even as revenue declined. Cost of materials consumed increased to Rs 72.2 crore from Rs 57.9 crore, while changes in inventories were minus Rs 20.4 crore versus minus Rs 7.5 crore in H1 FY26. Employee expenses rose to Rs 22.7 crore from Rs 17.5 crore, while other expenses declined to Rs 22.4 crore from Rs 24.4 crore.
The resulting EBITDA loss was Rs 90 lakh, compared with EBITDA of Rs 7 crore in the prior-year half. Depreciation increased to Rs 3.5 crore from Rs 2.8 crore and finance cost rose to Rs 2 crore from Rs 1.8 crore. Earnings before interest and tax changed from a Rs 4.5 crore profit to a Rs 4.3 crore loss, while profit before tax moved from a Rs 2.7 crore profit to a Rs 6.2 crore loss.
A tax credit of Rs 30 lakh in H1 FY27 followed a tax charge of Rs 80 lakh in H1 FY26, but did not prevent the loss after tax. Kamdhenu Ventures reported a Rs 5.9 crore loss after tax, compared with a Rs 1.9 crore profit. The profit-after-tax margin changed to minus 5.7% from 1.8%, and the EBITDA margin changed to minus 0.9% from 6.6%.
How did Kamdhenu Ventures’ Q2 FY27 performance compare?
Kamdhenu Ventures increased Q2 FY27 revenue by 2%, but quarterly EBITDA declined 70% and profit after tax turned into a loss. Revenue reached Rs 58.1 crore, compared with Rs 56.8 crore in Q2 FY26, while EBITDA fell to Rs 1.1 crore from Rs 3.7 crore. EBITDA margin declined to 1.9% from 6.5%.
Quarterly gross profit increased to Rs 25.4 crore from Rs 25 crore, although gross-profit margin slipped to 43.7% from 44%. Employee expenses rose to Rs 11.8 crore from Rs 9 crore, while other expenses were Rs 12.5 crore compared with Rs 12.3 crore. The higher cost base left EBITDA lower despite the increase in sales.
Profit after tax was a Rs 1.5 crore loss in Q2 FY27, compared with a Rs 1 crore profit in Q2 FY26. Depreciation increased to Rs 1.8 crore from Rs 1.4 crore, and finance cost rose to Rs 1.1 crore from Rs 1 crore. The quarterly profit-after-tax margin moved to minus 2.6% from 1.8%.
Got a follow-up? Ask IRIS
What changed in Kamdhenu Ventures’ balance sheet by September 2026?
Kamdhenu Ventures’ total assets and total equity and liabilities increased to Rs 301.2 crore at September 2026 from Rs 286.6 crore at March 2026. Current assets rose to Rs 239.2 crore from Rs 226.4 crore, while current liabilities increased to Rs 106.8 crore from Rs 90.2 crore. Total equity declined to Rs 172.9 crore from Rs 178.7 crore.
Inventories increased by Rs 27 crore to Rs 83 crore at September 2026, while trade receivables declined to Rs 145.8 crore from Rs 147 crore. Property, plant and equipment increased to Rs 49.4 crore from Rs 44.4 crore. Capital work in progress fell to Rs 50 lakh from Rs 3 crore over the same period.
Cash and cash equivalents fell to Rs 3.9 crore at September 2026 from Rs 18.6 crore at March 2026. Trade payables increased to Rs 69.5 crore from Rs 53.3 crore, while current borrowings rose to Rs 26 crore from Rs 24.7 crore. Non-current borrowings increased to Rs 6.1 crore from Rs 2.2 crore.
Why did Kamdhenu Ventures’ operating cash flow turn negative?
Kamdhenu Ventures recorded minus Rs 12 crore of net cash from operating activities in the six months to September 2026, compared with Rs 50 lakh of inflow in the six months to September 2025. Operating profit before working-capital changes fell to Rs 20 lakh from Rs 7.6 crore. Working-capital changes used Rs 12.2 crore, compared with an outflow of Rs 5.3 crore a year earlier.
Cash generated from operations was minus Rs 12 crore, compared with Rs 2.3 crore generated in the prior-year period. Direct taxes paid, net of refunds, were Rs 10 lakh in the latest period, compared with Rs 1.8 crore a year earlier. The cash-flow statement does not separately identify the individual working-capital movements, although inventories increased by Rs 27 crore between March and September 2026.
Investing activities used Rs 4.9 crore in the six months to September 2026, compared with Rs 3.5 crore in the prior-year period. Financing activities provided Rs 2.2 crore, down from Rs 3 crore. Combined cash flows reduced cash and cash equivalents by Rs 14.7 crore from the opening Rs 18.6 crore balance to Rs 3.9 crore at period end.
Conclusion
Kamdhenu Ventures’ first-half figures show that the 2% revenue decline was accompanied by a wider deterioration in earnings and cash generation. Gross profit declined by Rs 4.7 crore, EBITDA changed from a Rs 7 crore profit to a Rs 90 lakh loss, and profit after tax moved from a Rs 1.9 crore profit to a Rs 5.9 crore loss. Working-capital outflow of Rs 12.2 crore compounded the decline in operating cash generation.
The main disclosed matters to watch are the movement in inventories after the Rs 27 crore increase since March 2026, the level of trade payables after their Rs 16.2 crore increase, and cash after the balance declined to Rs 3.9 crore at September 2026. Subsequent results would also indicate whether the Rs 22.7 crore employee-expense run rate and minus 0.9% H1 EBITDA margin change.