










Kamdhenu Paints reports 81% water-based mix in H1 FY27
Key highlights
- Water-based products rose to 81% of Kamdhenu Paints’ mix in H1 FY27 from 58% in FY16, a 23-percentage-point increase.
- Powder-based products fell to 7% in H1 FY27 from 20% in FY16, while solvent-based products declined to 12% from 22%.
- Kamdhenu Paints reported 4,457 dealers, more than 20,000 painters, 36,000 kilolitres per annum of manufacturing capacity and more than 1,820 active tinting machines.
- The company reported more than 40 stock-keeping units, but did not disclose product-level revenue, volume or profitability.
powered by IRIS
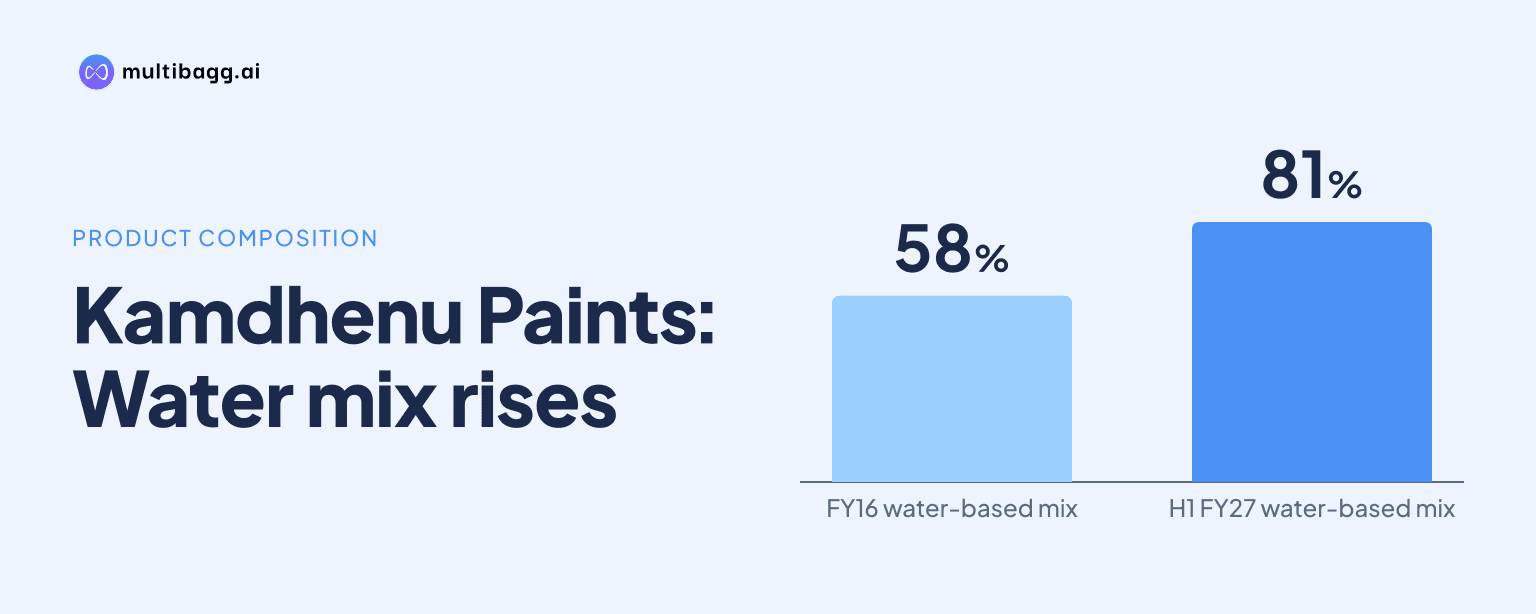
Kamdhenu Colour and Coatings Limited said its Kamdhenu Paints portfolio was 81% water-based in H1 FY27, compared with 58% in FY16, while premium products accounted for 43% of the portfolio. The mix has moved away from powder-based and solvent-based products, although average selling price was 76 per kg/litre in H1 FY27, below 87 in FY25.
Know Kamdhenu Ventures inside out
Results, valuation, peers and who's buying, in one view.
How has Kamdhenu Paints' product mix changed since FY16?
Kamdhenu Paints increased water-based products to 81% of its mix in H1 FY27 from 58% in FY16, a rise of 23 percentage points. Powder-based products declined to 7% from 20%, while solvent-based products fell to 12% from 22%. Together, powder-based and solvent-based products represented 19% of the H1 FY27 mix, compared with 42% in FY16.
Kamdhenu Paints said its initial entry strategy centred on affordable variants, including powder-based paints, putty and distempers, to gain the confidence and loyalty of dealers and painters. After building that base, the brand said it prioritised premium offerings and gradually reduced low-priced dealers to focus on premium dealers.
The H1 FY27 mix on the company profile page also shows 81% water-based, 12% solvent-based and 7% powder-based products. Kamdhenu Paints describes its product development approach as focused on water-based, low-volatile-organic-compound paints, but the presentation does not disclose revenue, volume or profitability by product category.
What products are in Kamdhenu Paints' premium portfolio?
Kamdhenu Paints said premium products account for 43% of its portfolio, supported by premium exterior, interior and dual-emulsion ranges. Premium exterior emulsions include Weather Supreme Shyne, Weather Supreme Advance Shyne, Weather Supreme and Weather Classic Advance Shyne, while premium interior emulsions include Kamo Hi-Sheen, Velvety, Sheen n Shine and Kamorich.
The premium dual-emulsion range includes KamoDual Luxury Emulsion, KamoDual Platinum, KamoDual Pearl Shyne and KamoDual Gold. The broader portfolio also includes texture products such as Mosaccio, Pearla, Stucco and Velvetino, as well as wood-coating products including Kamolac PU Wood Finish and Kamolac Water Base Wood Finishes.
Kamdhenu Paints reports more than 40 stock-keeping units across exterior and interior emulsions, primers, wood finishes, textured and designer paints, and construction chemicals. The presentation does not attach a date to the 43% premium-product figure, define the products counted in it, or provide a premium-product revenue split.
Got a follow-up? Ask IRIS
Has premiumisation increased Kamdhenu Paints' selling price?
Kamdhenu Paints reported an average selling price of 76 per kg/litre in H1 FY27, 11 per kg/litre below the FY25 figure of 87 but 18 per kg/litre above FY15's 58. The presentation describes its premiumisation programme as leading to improved average selling price per kg/litre and displays a 32% figure, without specifying the comparison period for that percentage.
The reported figures show two different comparisons. H1 FY27 pricing was above the FY15 level, alongside the increase in water-based products from 58% to 81%. However, H1 FY27 average selling price was below the FY25 figure despite the reported 43% premium-product share, so the supplied data does not establish an uninterrupted rise in realised selling price.
Kamdhenu Paints does not explain the difference of 11 per kg/litre between FY25 and H1 FY27. The presentation provides no bridge for the effects of product mix, discounts, pack sizes, regional sales or other factors, and H1 FY27 is a partial period while FY25 is a full financial year.
How is Kamdhenu Paints supporting premiumisation?
Kamdhenu Paints said designer galleries, reward schemes and incentives, refreshed branding and advertising are part of its renewed premium-product focus. It linked these measures to the reported 43% premium-product share and said dealer count had increased to 4,457; its company profile also listed more than 4,450 dealers as of 30 September 2026.
The brand's promotional channels include national newspapers such as The Indian Express, Dainik Bhaskar, The Financial Express and The Economic Times, as well as regional titles including Rajasthan Patrika, Jansatta and Punjab Kesari. It also lists catalogues, brochures, shop branding, sample boards, branded mason kits and digital campaigns designed to educate consumers about product benefits.
Kamdhenu Paints reported a painter network of more than 20,000, own manufacturing capacity of 36,000 kilolitres per annum and more than 1,820 active tinting machines. The presentation does not allocate capacity or tinting infrastructure between premium and non-premium products, or disclose campaign spending, premium volumes or returns from the promotional initiatives.
Conclusion
Kamdhenu Paints has reshaped its product mix since FY16, raising water-based products by 23 percentage points to 81% while reducing powder-based and solvent-based products to 7% and 12%, respectively. Management also reports that premium products form 43% of the portfolio. The key qualification is that H1 FY27 average selling price of 76 per kg/litre remained below the FY25 figure of 87.
The next disclosure to watch is the execution of management's stated premiumisation plan through designer galleries, incentives, branding and a greater focus on premium dealers. Further clarity on the date and definition of the 43% premium-product measure, together with product-level revenue information and an explanation of the H1 FY27 selling-price outcome, would show how the portfolio shift is translating into sales mix.