










Kotyark Q2 profit rose 148% as lower-cost stock lifted margins
Key highlights
- Kotyark’s Q2FY27 PAT rose 147.62% to Rs 6.24 crore despite a 5.53% revenue decline.
- Q2FY27 EBITDA margin expanded 773 basis points to 20.72% as total expenditure fell 13.95% to Rs 48.60 crore.
- H1FY27 revenue increased 4.03% to Rs 153.25 crore and PAT grew 61.88% to Rs 10.70 crore.
- Kotyark disclosed a Rs 233.45 crore order book and an estimated Rs 15 crore pipeline.
powered by IRIS
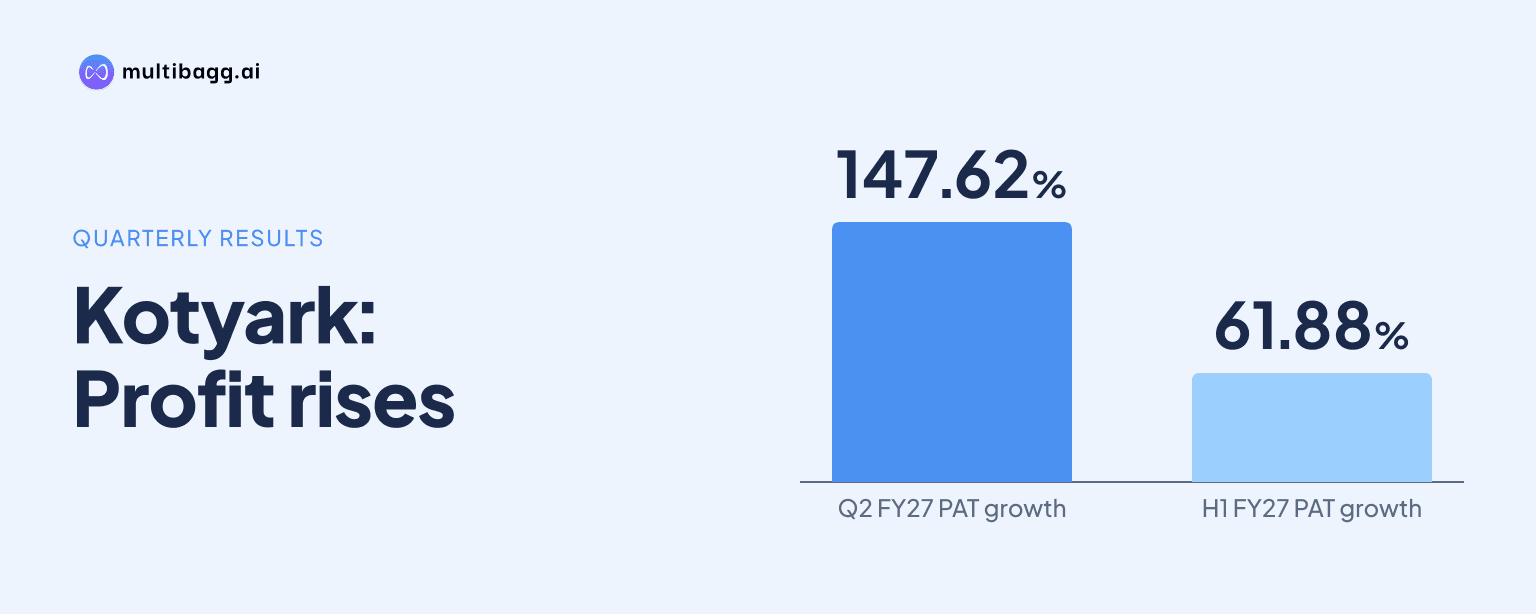
Kotyark Industries Limited reported Q2FY27 profit after tax of Rs 6.24 crore, up 147.62% year on year, although revenue declined 5.53% to Rs 61.27 crore. Total expenditure fell 13.95% to Rs 48.60 crore as it consumed previously procured lower-cost raw materials, lifting the EBITDA margin to 20.72%.
Know Kotyark Industries inside out
Results, valuation, peers and who's buying, in one view.
What drove Kotyark’s Q2FY27 profit increase?
Kotyark’s Q2FY27 profit increase was driven by reduced costs rather than higher sales. Revenue fell by Rs 3.59 crore to Rs 61.27 crore from Rs 64.86 crore in Q2FY26, while total expenditure declined by Rs 7.88 crore to Rs 48.60 crore from Rs 56.48 crore.
Management attributed the reduction principally to consumption of raw materials purchased earlier at comparatively lower prices. Raw-material expense fell 13.0% to Rs 44.90 crore from Rs 51.63 crore, accounting for Rs 6.73 crore of the total cost reduction. Other expenses declined 37.64% to Rs 2.17 crore from Rs 3.48 crore, while employee-benefit expense increased 10.95% to Rs 1.52 crore.
Earnings before interest, tax, depreciation and amortisation, or EBITDA, increased Rs 4.27 crore to Rs 12.70 crore. Finance cost rose 9.47% to Rs 1.85 crore, but depreciation and amortisation fell 29.66% to Rs 2.49 crore. Profit before tax rose 161.30% to Rs 8.36 crore, and profit after tax, or PAT, increased by Rs 3.72 crore despite tax expense rising to Rs 2.12 crore from Rs 0.68 crore.
How much did Kotyark’s margins improve in Q2FY27?
Kotyark’s EBITDA margin improved to 20.72% in Q2FY27 from 12.99% in Q2FY26, an increase of 773 basis points. Its PAT margin rose 630 basis points to 10.18% from 3.88%, showing that the expenditure reduction outpaced the decline in quarterly income.
Total income, including other income, decreased 5.6% to Rs 61.29 crore from Rs 64.91 crore. Yet EBITDA was Rs 12.70 crore, compared with Rs 8.43 crore a year earlier. The resulting margin change was primarily associated with the Rs 6.73 crore fall in raw-material expense and the Rs 1.31 crore reduction in other expenses.
Earnings per share rose 139.13% to Rs 0.55 from Rs 0.23. The presentation does not disclose separate quarterly revenue or profit for biodiesel and crude glycerin, so it does not quantify the contribution of either product to the Q2 margin expansion.
How did Kotyark’s H1FY27 results compare with Q2?
Kotyark’s first-half, or H1FY27, results showed revenue growth and a smaller margin increase than Q2. H1FY27 revenue rose 4.03% to Rs 153.25 crore, while PAT increased 61.88% to Rs 10.70 crore and EBITDA rose 30.19% to Rs 24.41 crore.
The contrast with Q2 was most visible in costs. Raw-material expense was nearly unchanged in H1FY27, increasing 0.29% to Rs 120.39 crore, compared with a 13.0% decline in Q2 alone. Total expenditure rose 0.17% to Rs 128.87 crore for the half year, unlike the 13.95% Q2 reduction.
H1FY27 EBITDA margin increased 321 basis points to 15.93%, less than Q2’s 773-basis-point expansion. PAT margin rose 250 basis points to 6.98%. Depreciation and amortisation declined 22.34% to Rs 4.97 crore, while tax expense rose to Rs 5.13 crore from Rs 2.31 crore. These figures indicate that the lower-cost inventory effect cited by management was particularly pronounced in Q2.
Got a follow-up? Ask IRIS
Can Kotyark sustain the Q2FY27 margin level?
Kotyark has not said that its 20.72% Q2FY27 EBITDA margin will continue, and management disclosed that raw-material prices have since increased. Management’s stated aspiration is an EBITDA margin of 18% to 22% over the next three years, supported by plant utilisation, operating efficiency, integrated sourcing and value-added products.
Kotyark says it can process about 10 to 15 raw materials, including used cooking oil, acid oils and non-edible oils, depending on availability and procurement economics. Used cooking oil represents approximately 84% to 86% of major raw materials, while alcohol represents approximately 10% to 20%. The multi-feedstock model is the company’s stated mechanism for adjusting sourcing to pricing and availability.
The company has annual biodiesel capacity of 4,80,000 kilolitres and crude glycerin capacity of about 63,000 kilolitres. At 31 March 2026, Sirohi, Rajasthan, had utilisation of 5% to 6%, while Anand, Gujarat, operated at 30%. Management targets raising overall utilisation from about 7% to 8% to about 60% to 70% over the medium term.
What demand indicators and plans does Kotyark disclose?
Kotyark disclosed approximately Rs 173.45 crore of orders from oil marketing companies, or OMCs, and approximately Rs 60 crore from other parties, alongside an estimated Rs 15 crore pipeline under discussion. The disclosed order book therefore totals about Rs 233.45 crore before the pipeline, but the presentation provides no delivery dates, contract pricing or margin details.
Kotyark serves OMCs, bulk buyers and industrial users. Its tender process involves OMC allocations, tender agreements and purchase orders, letters of intent or supply indents before delivery. The company identifies OMC tender cycles and procurement timing as earnings sensitivities and says it is expanding industrial, retail and glycerin sales to diversify revenue channels.
Management targets revenue compound annual growth of 25% to 30% over the next three years. Its FY27 plan focuses on raising utilisation of the 4,80,000-kilolitre capacity, while FY28 priorities include distribution, logistics integration and glycerin processing. FY29 plans include exploring carbon-credit monetisation and downstream biofuel opportunities.
Conclusion
Kotyark’s Q2FY27 results show that profit growth was cost-led rather than sales-led. Revenue declined 5.53%, but earlier lower-cost raw-material purchases, reduced other expenses and lower depreciation helped EBITDA rise 50.70% and PAT increase 147.62%. The H1FY27 figures, where raw-material expense was broadly flat, indicate that the Q2 cost movement was more pronounced than the first-half trend.
The next items to watch are whether higher raw-material prices affect quarterly expenditure, whether EBITDA margin stays within management’s 18% to 22% aspiration, and whether utilisation rises from about 7% to 8% toward the 60% to 70% target. Delivery against the Rs 233.45 crore disclosed order book and the FY27 to FY29 operating plan will determine whether growth comes with the planned utilisation gains.