










KPIL H1 FY27 profit rose 34% as PBT margin reached 6.1%
Key highlights
- KPIL's consolidated H1 FY27 PAT increased 34% year on year to Rs 603 crore.
- KPIL's H1 FY27 PBT margin expanded 130 basis points to 6.1%.
- KPIL's comparable revenue excluding road SPVs and the Brazil subsidiary rose 11% to Rs 13,391 crore.
- KPIL's consolidated net debt fell to Rs 72 crore at Q2 FY27 from Rs 3,169 crore at Q2 FY26.
powered by IRIS
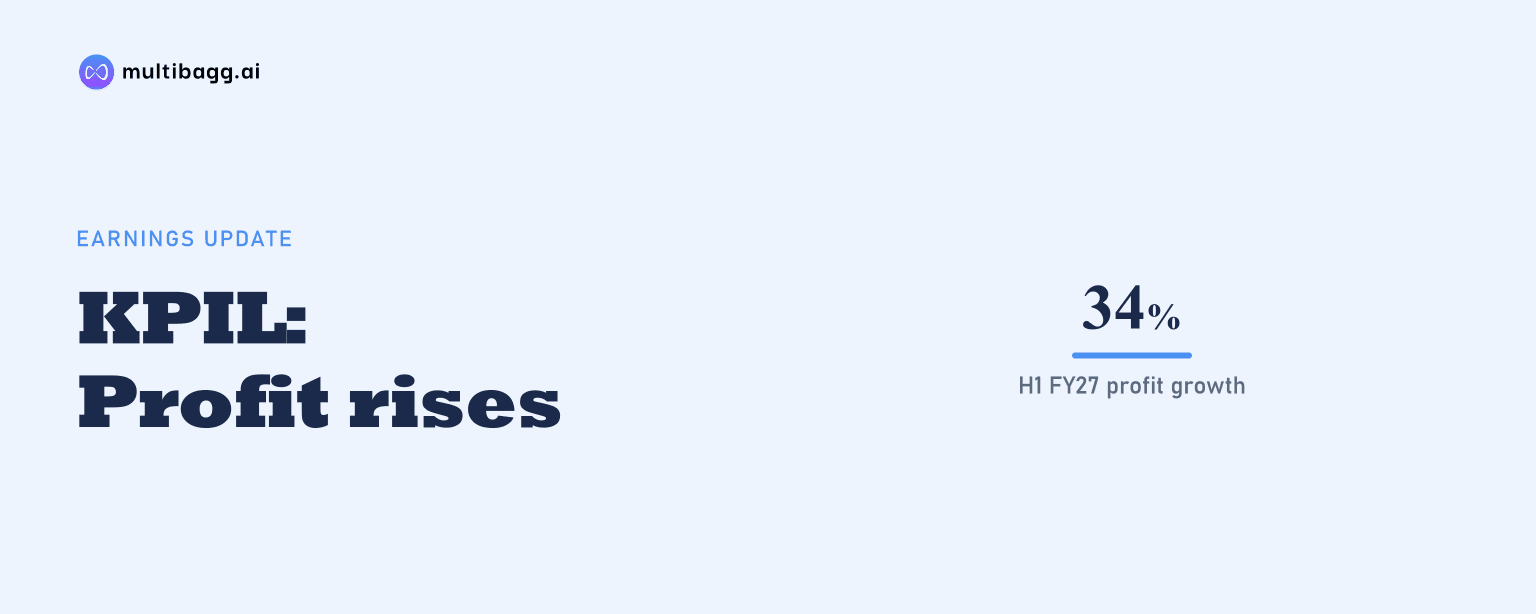
Kalpataru Projects International Limited (KPIL) reported consolidated net profit of Rs 603 crore in H1 FY27, up 34% year on year, while profit before tax (PBT) margin expanded 130 basis points to 6.1%. Reported revenue rose 6% to Rs 13,412 crore, while lower finance cost and higher other income accompanied faster profit growth.
Know Kalpataru Projects International inside out
Results, valuation, peers and who's buying, in one view.
How did KPIL's H1 FY27 profit outpace revenue?
KPIL's profit outpaced reported revenue in H1 FY27, with PBT and profit after tax (PAT) each increasing 34%, compared with 6% growth in reported revenue. PBT rose to Rs 818 crore from Rs 612 crore, while PAT increased to Rs 603 crore from Rs 451 crore. Earnings per share (EPS) rose 32% to Rs 35.08 from Rs 26.57.
Reported revenue included Rs 21 crore from road special purpose vehicles (SPVs) and the Brazil subsidiary in H1 FY27, against Rs 598 crore a year earlier. Excluding these operations, which KPIL said had no or minimal activity in FY27, comparable revenue increased 11% to Rs 13,391 crore from Rs 12,102 crore. The lower contribution from these operations reduced the reported revenue growth rate relative to comparable revenue growth.
What moved KPIL's PBT margin to 6.1%?
KPIL's PBT margin reached 6.1% in H1 FY27, up from 4.8% in H1 FY26, as finance cost declined and other income increased despite a broadly steady core operating margin. Core earnings before interest, tax, depreciation and amortisation (Core EBITDA) increased 5% to Rs 1,143 crore, while its margin edged down 10 basis points to 8.5% from 8.6%.
Finance cost fell to Rs 173 crore in H1 FY27 from Rs 259 crore in H1 FY26, a reduction of Rs 86 crore. Other income rose to Rs 121 crore from Rs 39 crore, an increase of Rs 82 crore. These changes were partly offset by depreciation, which rose by Rs 18 crore to Rs 273 crore, while PBT increased by Rs 206 crore.
The pre-tax improvement also carried through after tax, although tax expense increased to Rs 215 crore from Rs 161 crore. PAT margin expanded 90 basis points to 4.5% from 3.6%. In Q2 FY27, PBT margin was 5.7%, up 80 basis points year on year, while PAT margin was 4.2%, up 60 basis points.
Got a follow-up? Ask IRIS
Which KPIL businesses drove comparable revenue growth?
KPIL's comparable core-business revenue growth was led by Oil & Gas and Buildings & Factories (B&F), while Water and Infrastructure recorded lower revenue in H1 FY27. Total core-business revenue, excluding the Brazil subsidiary, rose 11% to Rs 13,242 crore from Rs 11,952 crore. Oil & Gas revenue increased 38% to Rs 1,577 crore, and B&F revenue rose 17% to Rs 3,619 crore.
KPIL attributed Oil & Gas growth to Middle East projects and said it secured its first major United Arab Emirates gas-pipeline infrastructure project. B&F growth reflected favourable project mix and execution in residential building projects, according to KPIL. Transmission and distribution (T&D) revenue, excluding the Brazil subsidiary, increased 8% to Rs 5,993 crore, supported by order backlog and improved project progress.
Water revenue declined 5% to Rs 1,124 crore, although KPIL said execution was in line with planned project progress and that it secured its first Middle East water-treatment and supply project. Infrastructure revenue declined 7% to Rs 929 crore as KPIL focused on project closure in conventional railways, while metro-rail execution continued. T&D remained the largest core business by H1 FY27 revenue at Rs 5,993 crore.
How did KPIL's standalone results compare with consolidated results?
KPIL's standalone H1 FY27 revenue and Core EBITDA grew faster than its consolidated reported figures, while consolidated PAT was higher in absolute terms. Standalone revenue increased 12% to Rs 11,695 crore, compared with 6% growth in consolidated reported revenue to Rs 13,412 crore. Standalone Core EBITDA rose 15% to Rs 1,011 crore and its margin improved 20 basis points to 8.6%.
Standalone PBT increased 33% to Rs 728 crore and PAT rose 33% to Rs 534 crore. The standalone PBT margin expanded 100 basis points to 6.2%, compared with a 130-basis-point increase in the consolidated PBT margin to 6.1%. Standalone PAT margin increased 80 basis points to 4.6%, which was 10 basis points above the consolidated PAT margin of 4.5%.
The financing movement was also evident in the standalone accounts, where finance cost declined to Rs 148 crore from Rs 187 crore. At 30 September 2026, consolidated net debt was Rs 72 crore, down from Rs 3,169 crore at Q2 FY26, while consolidated net working capital (NWC) days reduced to 68 from 90. Standalone net debt declined to Rs 398 crore from Rs 2,189 crore over the same comparison.
Conclusion
KPIL's H1 FY27 result combined 11% comparable revenue growth with a 34% increase in both PBT and PAT. The reported revenue comparison was affected by the reduction in road SPV and Brazil subsidiary revenue to Rs 21 crore from Rs 598 crore, while core businesses delivered Rs 13,242 crore of revenue. Finance cost fell by Rs 86 crore and other income rose by Rs 82 crore as PBT margin expanded to 6.1%.
The next measure is whether execution converts the order position into revenue while maintaining the H1 FY27 profitability trend. KPIL reported an order book of Rs 71,846 crore at 30 September 2026, including Rs 29,389 crore in T&D and Rs 21,659 crore in B&F, and said it was additionally favourably placed in projects of about Rs 5,000 crore. Progress on Middle East Oil & Gas and Water projects, alongside working-capital movement after NWC days fell to 68, is also disclosed for monitoring.