










LIC non-par individual APE falls 6% as mix share drops to 34%
Key highlights
- LIC’s individual non-par APE fell 5.98% to Rs 5,861 crore in H1 FY27.
- LIC’s non-par share of individual APE declined to 34.03% from 36.31% in H1 FY26.
- LIC’s total APE increased 5.72% to Rs 30,696 crore, led by 13.55% group-APE growth.
- LIC’s net VNB rose 33.95% to Rs 6,846 crore and net VNB margin reached 22.3%.
powered by IRIS
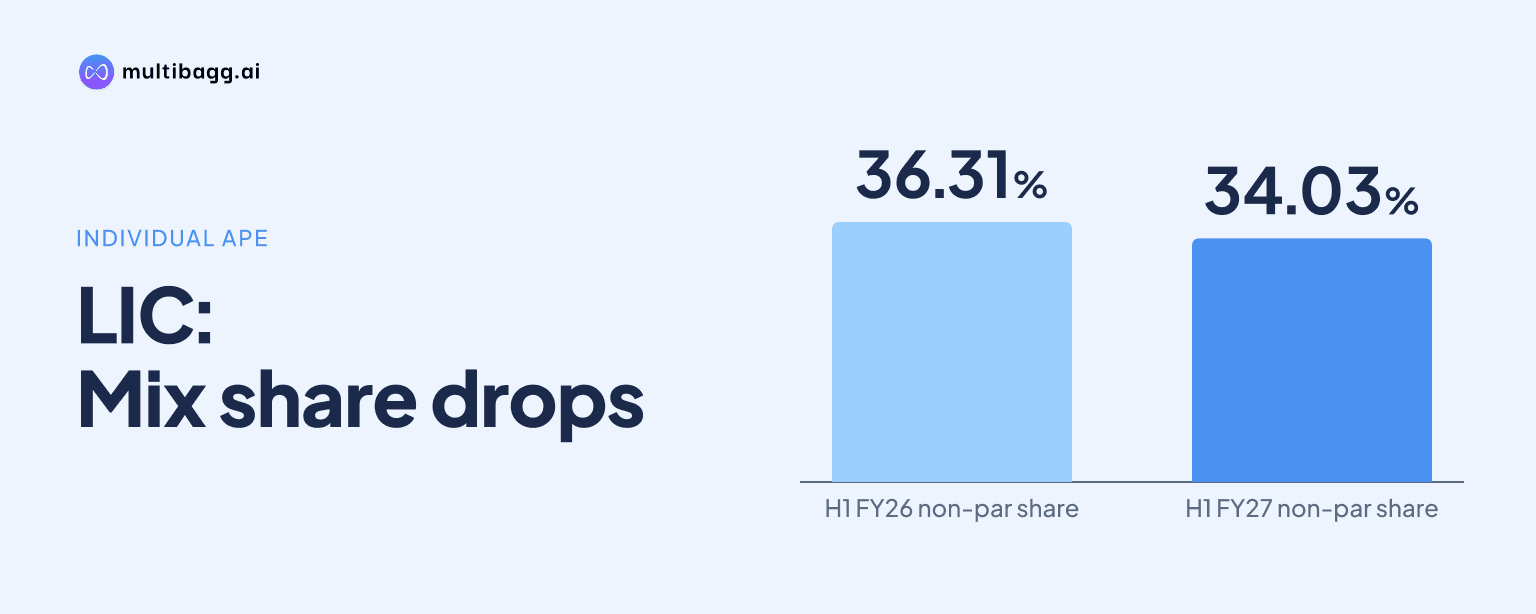
Life Insurance Corporation of India reported a 5.98% year-on-year fall in individual non-par annualized premium equivalent (APE) to Rs 5,861 crore for the six months ended September 30, 2026, reducing its share of individual APE to 34.03% from 36.31% a year earlier. LIC said the resulting share remained in line with its strategy of keeping non-par products at about one-third of individual APE.
Know Life Insurance Corporation of India inside out
Results, valuation, peers and who's buying, in one view.
Why did LIC’s non-par individual APE decline in H1 FY27?
LIC’s individual non-par APE declined because it reported Rs 5,861 crore for the six months ended September 30, 2026, against Rs 6,234 crore in the corresponding 2025 period. The 5.98% fall came while total individual-business APE increased marginally by 0.31% to Rs 17,224 crore from Rs 17,170 crore.
The individual APE movement therefore reflected a higher contribution from participating, or par, products. LIC reported par APE of Rs 11,364 crore in H1 FY27, equal to 65.98% of individual APE, while non-par products accounted for Rs 5,861 crore, or 34.03%. LIC’s product-mix table classifies linked products within the non-par category.
The product shares in LIC’s table shifted by 2.28 percentage points for non-par products and 2.29 percentage points for par products, with the small difference reflecting rounded reported figures. The company noted that figures may not add up to totals because of rounding, while the individual APE total was reported at Rs 17,224 crore for H1 FY27.
How did LIC’s individual product mix change from H1 FY26?
LIC’s non-par share of individual APE fell to 34.03% in H1 FY27 from 36.31% in H1 FY26, while the par share rose to 65.98% from 63.69%. The shift occurred despite the individual APE base changing by only Rs 54 crore, rising from Rs 17,170 crore to Rs 17,224 crore.
Total APE, which combines individual and group business, increased 5.72% to Rs 30,696 crore in H1 FY27 from Rs 29,034 crore in H1 FY26. Group APE rose 13.55% to Rs 13,472 crore from Rs 11,864 crore, compared with the 0.31% rise in individual APE, and group business accounted for 43.89% of total APE against 56.11% for individual business.
LIC’s premium-income data rose more quickly than individual APE, but these are distinct measures. Individual new-business premium income increased 14.86% to Rs 32,725 crore from Rs 28,491 crore, while individual renewal premium grew 4.68% to Rs 1,27,950 crore from Rs 1,22,224 crore. Total individual premium income consequently increased 6.61% to Rs 1,60,675 crore for the six months ended September 30, 2026.
Group business also recorded faster premium growth than individual business. Total group-business premium increased 19.62% to Rs 1,13,594 crore from Rs 94,965 crore, taking total premium income up 11.64% to Rs 2,74,269 crore from Rs 2,45,680 crore. LIC did not provide a product-level breakdown identifying the drivers of the Rs 373 crore reduction in non-par APE.
Got a follow-up? Ask IRIS
Is LIC’s 34.03% non-par mix within management’s stated strategy?
Yes, LIC management said the 34.03% non-par share of individual APE in H1 FY27 was in line with its current strategy of maintaining non-par products at one-third of individual APE. Chief Executive Officer and Managing Director R Doraiswamy made the statement with the results announced on November 5, 2026, although the reported share was lower than the 36.31% level in H1 FY26.
Management linked its stated product and channel diversification strategy with reported new-business profitability metrics. Net value of new business (VNB) increased 33.95% to Rs 6,846 crore in H1 FY27 from Rs 5,111 crore in H1 FY26. Net VNB margin increased by 470 basis points, where one basis point is one-hundredth of a percentage point, to 22.3% from 17.6%.
LIC also said the Banca and Alternate Channels share of individual new-business premium was 7.53% in H1 FY27, compared with 7.12% in the similar prior-year period. Management cited 21.44% growth in this context, but the filing does not give a channel-wise split of the Rs 5,861 crore in individual non-par APE or identify the channels behind its decline.
Profit after tax increased 21.52% to Rs 25,568 crore for the six months ended September 30, 2026, from Rs 21,040 crore a year earlier. LIC separately said it was working to optimize costs across the business, while its overall expense ratio declined by 87 basis points to 10.41% from 11.28%.
What other operating measures changed alongside LIC’s product mix?
LIC sold 70,97,094 individual policies in H1 FY27, down 2.25% from 72,60,573 policies in H1 FY26. Individual new-business premium nevertheless rose 14.86% to Rs 32,725 crore, while individual APE was nearly unchanged at Rs 17,224 crore, showing that the disclosed policy count, premium income and APE measures moved differently during the period.
LIC’s market share measured by first-year premium income was 58.77% for the half year ended September 30, 2026, compared with 59.41% in the corresponding period a year earlier. Its reported market share was 37.51% in individual business and 70.45% in group business for H1 FY27.
Persistency on a premium basis declined at both disclosed durations. The 13th-month ratio was 74.69% in H1 FY27 against 75.29% in H1 FY26, while the 61st-month ratio was 61.03% against 63.81%. On a number-of-policies basis, the 13th-month ratio increased to 67.58% from 63.36%, whereas the 61st-month ratio declined to 48.33% from 51.50%.
Assets under management increased 4.16% to Rs 59,60,941 crore as of September 30, 2026, from Rs 57,22,896 crore a year earlier, and the solvency ratio increased to 2.35 from 2.13. Indian Embedded Value moved in the other direction, falling 1.95% to Rs 7,97,378 crore from Rs 8,13,230 crore, while the yield on policyholders’ funds excluding unrealized gains was 8.67% against 8.90%.
Conclusion
LIC’s H1 FY27 disclosure shows that individual non-par APE declined 5.98% to Rs 5,861 crore even as total individual APE increased 0.31% to Rs 17,224 crore. The non-par mix consequently decreased to 34.03%, while par products represented 65.98%; group APE growth of 13.55% was the main contributor to the 5.72% increase in total APE.
The next reported period will show whether LIC maintains non-par products near management’s one-third target for individual APE and whether its 7.53% Banca and Alternate Channels share continues to rise. LIC also said it will adopt Indian Accounting Standards from April 1, 2027 after receiving a one-year deferral from the Insurance Regulatory and Development Authority of India, while its September 2026 results were prepared under Indian GAAP.