










Lux Industries Limited raises Q2 EBITDA margin despite revenue fall
Key highlights
- Lux Industries reported Q2 FY’27 revenue from operations of Rs 718.47 crore, down 7.74% year on year.
- Lux Industries' Q2 FY’27 operating EBITDA increased to Rs 46 crore from Rs 44 crore, lifting margin to 6.4% from 5.6%.
- Lux Industries' working-capital days increased to 217 in Q2 FY’27 from 204 in Q2 FY’26.
- Lux Industries reported HYE FY’27 operating EBITDA of Rs 89 crore, up from Rs 79 crore despite a 4.02% revenue decline.
powered by IRIS
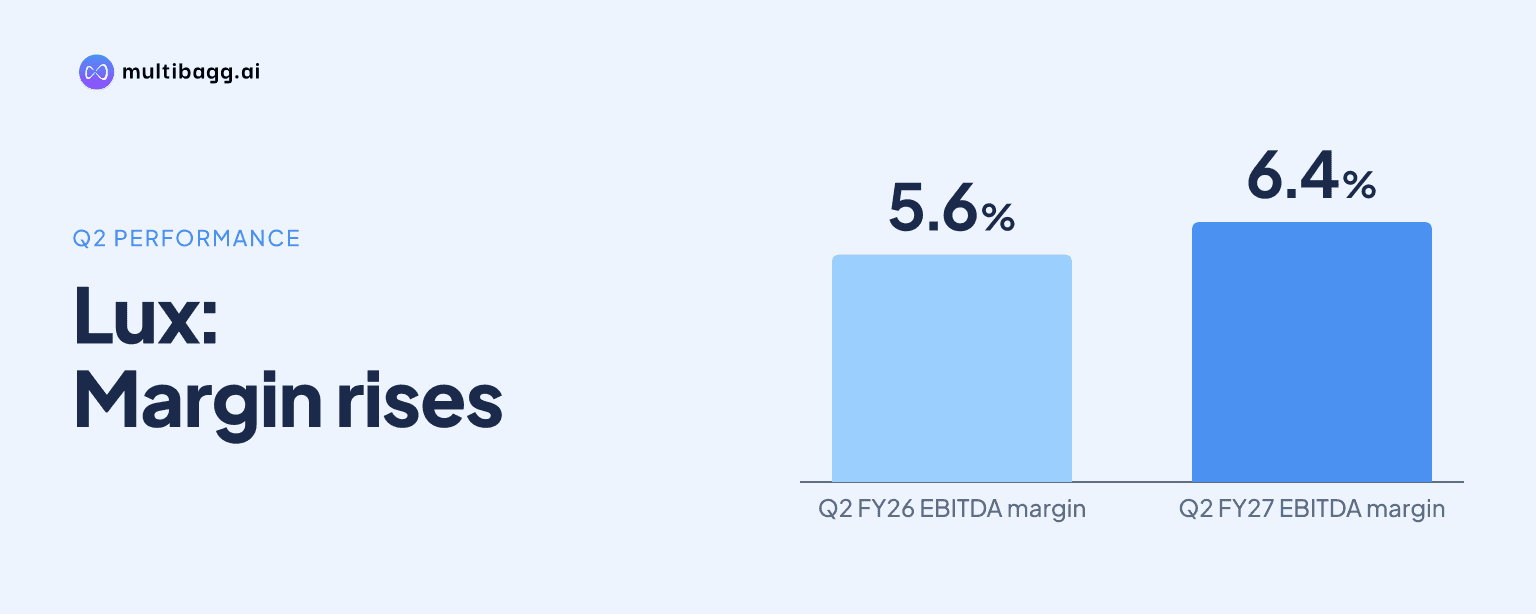
Lux Industries lifted operating EBITDA margin to 6.4% in Q2 of FY’27 from 5.6% a year earlier, despite revenue from operations falling 7.74% to Rs 718.47 crore. Operating EBITDA rose to Rs 46 crore from Rs 44 crore, while profit after tax increased to Rs 24 crore from Rs 23 crore.
Know Lux Industries inside out
Results, valuation, peers and who's buying, in one view.
Why did Lux Industries' Q2 EBITDA margin rise?
Lux Industries increased operating EBITDA by Rs 2 crore to Rs 46 crore in Q2 FY’27 even as revenue fell from Rs 779 crore in Q2 FY’26 to Rs 718 crore. EBITDA, or earnings before interest, tax, depreciation and amortisation, margin rose by 0.8 percentage points to 6.4%, while profit after tax (PAT) margin increased by 0.3 percentage points to 3.3%.
Vertical A reported a higher gross margin and lower advertisement expense during the quarter. Its revenue from operations declined to Rs 313.5 crore from Rs 375.6 crore, but gross margin increased to 34.9% from 31.0% and advertisement expense fell to Rs 17.3 crore from Rs 31.5 crore. Vertical A EBITDA rose to Rs 27.2 crore from Rs 25.9 crore, taking its EBITDA margin to 8.6% from 6.9%.
Vertical A’s cost of goods sold (COGS) declined to Rs 207.3 crore in Q2 FY’27 from Rs 261.1 crore a year earlier. Its employee cost rose to Rs 25.5 crore from Rs 22.8 crore, while other expenses increased to Rs 41.2 crore from Rs 37 crore. These disclosed changes accompanied the 1.7-percentage-point expansion in Vertical A’s EBITDA margin, although the presentation does not assign one specific cause for the consolidated margin movement.
Which segments caused Lux Industries' Q2 revenue decline?
Lux Industries’ Q2 revenue decline was concentrated in Vertical A, where revenue fell 16.57% year on year to Rs 313.47 crore. Vertical B reported revenue growth of 0.40% to Rs 322.76 crore and Vertical C recorded growth of 0.83% to Rs 82.24 crore, resulting in revenue from operations of Rs 718.47 crore compared with Rs 778.76 crore a year earlier.
Vertical A nevertheless delivered 50% revenue growth in its Winter Wear Segment, according to the business highlights. Lux Industries also reported 18% Q2 volume growth for Lux Venus and 43% export-volume growth in Vertical B. The presentation does not provide individual quarterly revenue figures for the Winter Wear Segment, Lux Venus or exports.
Segment profit before tax (PBT) did not follow the revenue pattern uniformly. Vertical A PBT was unchanged at Rs 15.05 crore, while Vertical B PBT fell 17.65% to Rs 14.96 crore and Vertical C PBT declined 16.90% to Rs 3.09 crore. Net other unallocable expenditure narrowed to Rs 1.49 crore from Rs 5.47 crore, and total PBT increased 0.46% to Rs 31.61 crore.
Got a follow-up? Ask IRIS
What were Lux Industries' half-year FY’27 earnings?
Lux Industries reported operating EBITDA of Rs 89 crore for the half-year ended (HYE) FY’27, up from Rs 79 crore in HYE FY’26, while revenue from operations declined 4.02% to Rs 1,327.50 crore. Operating EBITDA margin increased to 6.6% from 5.7%, and PAT rose to Rs 47 crore from Rs 46 crore, with the PAT margin reaching 3.5% from 3.3%.
Vertical A had the largest absolute half-year revenue decline, falling by Rs 39.66 crore to Rs 604.24 crore from Rs 643.90 crore. Vertical B revenue declined by Rs 12.31 crore to Rs 571.98 crore, while Vertical C revenue fell by Rs 3.62 crore to Rs 151.28 crore. Vertical A PBT increased 16.45% to Rs 30 crore, whereas Vertical B PBT fell 22.74% to Rs 27.46 crore.
Vertical A’s detailed HYE figures show EBITDA of Rs 54.8 crore on revenue from operations of Rs 604.3 crore, compared with EBITDA of Rs 45 crore on revenue of Rs 644.2 crore in the prior-year period. Gross margin rose to 35.4% from 31.7%, and advertisement expense declined to Rs 41.8 crore from Rs 58.4 crore. Finance cost increased to Rs 14.5 crore from Rs 11.7 crore and depreciation rose to Rs 10.3 crore from Rs 7.5 crore.
How did Lux Industries' working-capital cycle change?
Lux Industries’ working-capital days increased to 217 in Q2 FY’27 from 204 in Q2 FY’26. Inventory days rose to 149 from 136 and debtor days increased to 147 from 135, while creditor days increased to 79 from 67.
The 12-day increase in creditor days partly offset the increases in inventory and debtor days, but the overall working-capital cycle still lengthened by 13 days. Lux Industries describes its broader transformation as including strengthened working-capital management and improved liquidity, compared with high receivables days and low inventory turnover under its earlier model.
The Q2 indicators show that the reported cycle was longer than it was a year earlier, even as operating profitability improved. Inventory days accounted for 149 of the 217 working-capital days and debtor days accounted for 147, while creditor days were 79. The presentation does not provide a breakdown linking the working-capital change to a specific vertical or product category.
Lux Industries is also investing in information-technology infrastructure to build digital platforms and connect with channel partners as it pivots from a primarily offline model to an omni-channel innerwear and outerwear brand. The presentation states that the company is present on major ecommerce platforms and that advertisement spending is about 7%, but it does not provide a timetable or spending amount for the digital investment.
Conclusion
Lux Industries’ Q2 FY’27 results show that operating EBITDA and margins increased while revenue declined, with Vertical A’s higher gross margin and reduced advertisement expense accompanying its EBITDA growth. At the same time, Vertical B and Vertical C delivered marginal revenue growth but lower segment PBT, while the company’s overall working-capital cycle extended to 217 days.
The next results will show whether the omni-channel pivot, information-technology investment and brand-building expenditure of about 7% support revenue growth while containing the longer working-capital cycle. Management’s disclosed operating measures to monitor include the 18% Q2 volume growth for Lux Venus, 43% export-volume growth in Vertical B and the 50% Winter Wear Segment revenue growth in Vertical A.