










Manaksia Ltd Q2 FY27 PAT rises 6.6% as revenue slips 1%
Key highlights
- Manaksia Ltd reported Q2 FY27 consolidated revenue of ₹188 crore, down 1.0% year-on-year.
- Q2 FY27 EBITDA rose 75.6% year-on-year to ₹12 crore, and EBITDA margin improved to 6.5%.
- Manaksia Ltd reported Q2 FY27 PAT of ₹11 crore, up 6.6% year-on-year but down 58.1% quarter-on-quarter.
- H1 FY27 PAT was ₹37.9 crore, compared with ₹25.9 crore in H1 FY26.
powered by IRIS
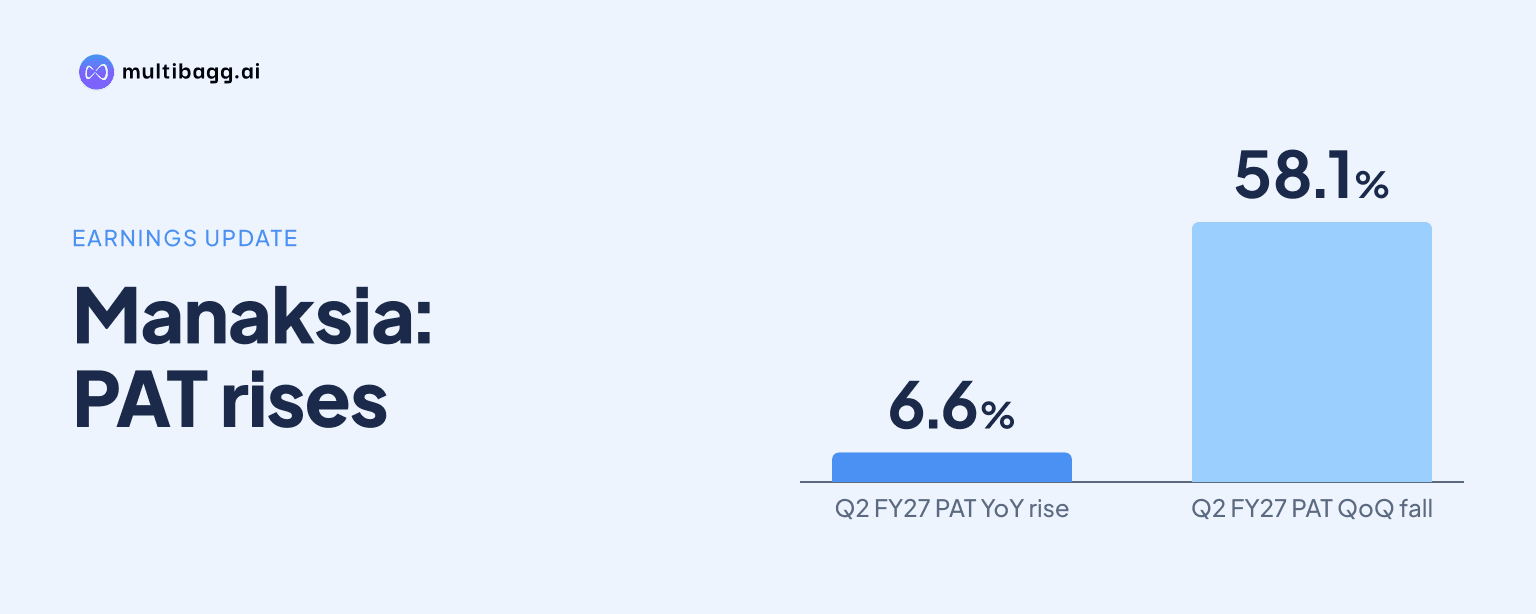
Manaksia Ltd reported consolidated revenue of ₹188 crore in Q2 FY27, down 1% year-on-year, while profit after tax rose 6.6% to ₹11 crore. The quarter showed improved operating profitability despite lower sales, with EBITDA margin expanding by 2.8 percentage points from a year earlier.
Know Manaksia Steels inside out
Results, valuation, peers and who's buying, in one view.
What did Manaksia Ltd report for Q2 FY27?
Manaksia Ltd reported consolidated revenue from operations of ₹188 crore for the quarter ended September 30, 2026, compared with ₹190 crore in Q2 FY26. The reported revenue was also 15.6% lower than ₹223 crore in Q1 FY27. The company’s detailed results statement put consolidated revenue from operations at ₹188.10 crore, based on ₹18,809.66 lakh.
Consolidated profit after tax was reported at ₹11 crore, an increase of 6.6% from about ₹10 crore in the corresponding quarter last year. However, PAT declined 58.1% sequentially from ₹27 crore in Q1 FY27. Profit before tax stood at ₹16 crore, up 4.8% year-on-year but down 56.1% quarter-on-quarter.
The Board of Directors approved the unaudited standalone and consolidated financial results for the quarter and half year ended September 30, 2026, at its meeting on November 13, 2026. The approval followed the Audit Committee’s recommendation, and the limited review report was unmodified.
How did Manaksia Ltd's operating margin change?
Manaksia Ltd's EBITDA rose 75.6% year-on-year to ₹12 crore, while its operating margin improved to 6.5% from 3.7% a year earlier. The 2.8 percentage-point margin expansion was the strongest improvement in the reported quarterly comparison and helped support profit growth despite the modest decline in revenue.
On a sequential basis, EBITDA fell 24.6% from ₹16 crore in Q1 FY27, and the operating margin declined by 0.8 percentage points from 7.3%. This indicates that the company’s Q2 operating performance was lower than in the immediately preceding quarter, even though margins remained materially above the prior-year level.
The reported financial data therefore presents two different comparisons. Against Q2 FY26, Manaksia Ltd generated a higher operating profit and net profit on slightly lower revenue. Against Q1 FY27, revenue, operating profit, profit before tax and net profit all declined.
Source: Manaksia Ltd consolidated results filing to NSE. Figures are rounded to the nearest ₹ crore.
Why did revenue and profit move differently during the quarter?
Manaksia Ltd's reported figures show that the improvement in operating margin offset the effect of lower revenue on year-on-year profitability. Revenue declined by about ₹2 crore from Q2 FY26, whereas EBITDA increased by about ₹5 crore and PAT increased by about ₹1 crore over the same period.
The results information provided does not specify product-wise volumes, pricing changes, raw-material costs, segment performance or other operating drivers behind the margin movement. It also does not provide a quantified capital-expenditure figure or a capex update for the quarter. These items cannot be inferred solely from the reported consolidated profit and loss figures.
The sequential decline was more pronounced than the year-on-year change. Revenue fell by about ₹35 crore from Q1 FY27, while PAT declined by about ₹16 crore. The lower sequential profit followed a Q1 in which Manaksia Ltd had reported profit before tax of ₹37 crore and PAT of ₹27 crore.
Got a follow-up? Ask IRIS
What does the half-year performance show?
Manaksia Ltd reported H1 FY27 PAT of ₹37.9 crore, compared with ₹25.9 crore in H1 FY26. This represents an increase of ₹12.0 crore for the six-month period, based on the figures disclosed in the board-meeting outcome.
The half-year comparison provides important context for the Q2 sequential decline. Although Q2 PAT was below the Q1 level, the company’s first-half profit was higher than in the prior-year half. The available disclosure does not provide a complete H1 revenue, EBITDA or margin comparison in the supplied results summary.
For investors, the Q2 release places emphasis on the distinction between quarterly momentum and the first-half position. The year-on-year rise in Q2 PAT and the increase in H1 PAT indicate higher reported profitability than the respective prior-year periods, while the quarter-on-quarter figures point to a lower contribution in the September quarter than in the June quarter.
How does the result affect investors and company monitoring?
The Q2 figures give investors a reported reference point for Manaksia Ltd's revenue trend, operating margin and profit conversion. The central data point is that EBITDA margin increased to 6.5% even as revenue was lower year-on-year. Whether that margin level is sustained will depend on later disclosures and operating conditions not detailed in the results summary.
The board-meeting outcome confirmed that the financial statements underwent a limited review without modification. This provides the formal basis for the reported quarterly and half-year figures. The supplied information does not disclose a new capital-expenditure programme, revised financial target, dividend decision or forward financial guidance.
The results should also be assessed separately from disclosures by other Manaksia group entities, including Manaksia Coated Metals & Industries Ltd and Manaksia Steels Ltd. Their revenue, profitability, export exposure and board announcements relate to separate listed companies and are not measures of Manaksia Ltd's consolidated Q2 FY27 performance.
Conclusion
Manaksia Ltd closed Q2 FY27 with consolidated revenue of ₹188 crore and PAT of ₹11 crore. Revenue was 1% below the year-earlier level, but EBITDA rose 75.6% and the operating margin improved to 6.5%, enabling a 6.6% increase in reported net profit. The quarter was weaker sequentially, with revenue down 15.6% and PAT down 58.1% from Q1 FY27.
The next reported reference point is the company’s subsequent quarterly filing, which can clarify whether the higher operating margin is maintained and how revenue progresses after the Q2 sequential decline. Investors can also monitor any future disclosure on segment performance, cost drivers, capital expenditure or financial guidance, none of which was quantified in the supplied Q2 results summary.