










Manorama H1 FY27 profit rose 59% while gross margin fell
Key highlights
- Manorama reported H1FY27 consolidated revenue of Rs 862.87 crore, up 40.8% year on year.
- Manorama’s H1FY27 PAT rose 59.2% year on year to Rs 159.47 crore.
- Manorama reported H1FY27 gross profit margin of 43.0%, down 482 basis points year on year.
- Manorama’s working-capital days rose to 233 in H1FY27 from 123 in FY26.
powered by IRIS
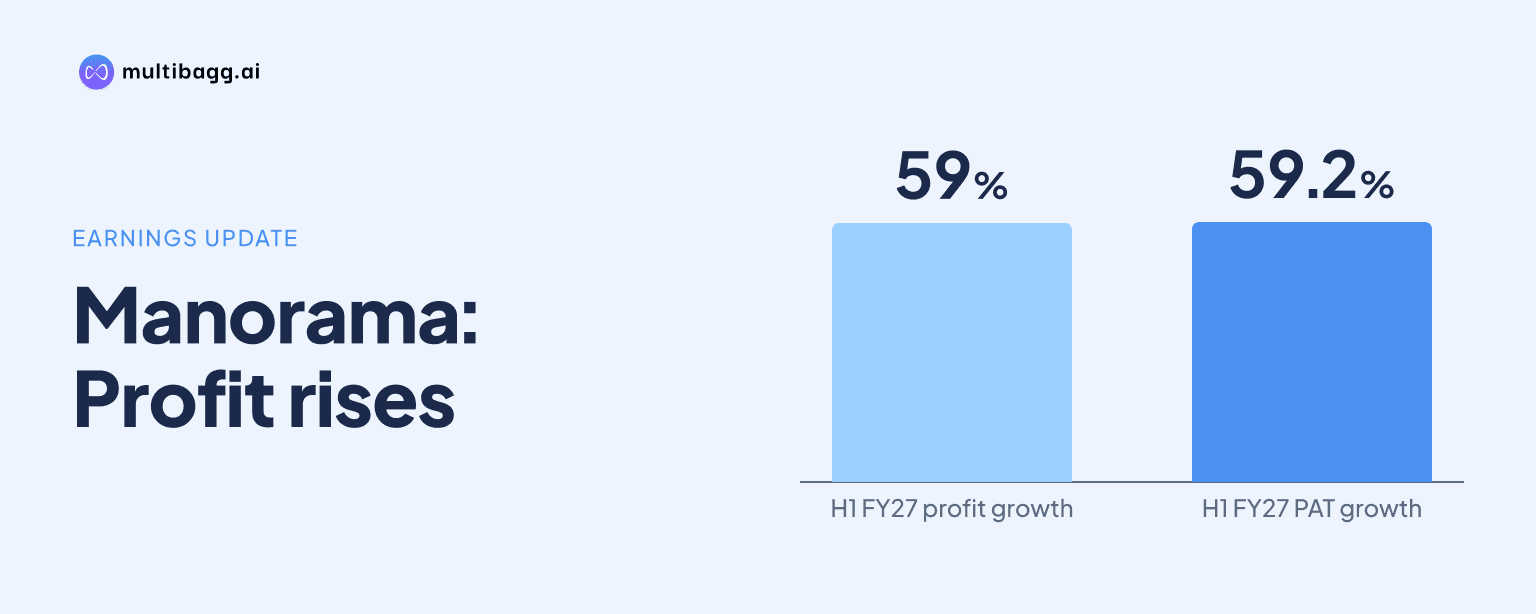
Manorama Industries Limited reported consolidated H1FY27 profit after tax of Rs 159.47 crore, up 59.2% year on year, while its reported gross profit margin declined 482 basis points to 43.0% as revenue increased 40.8% to Rs 862.87 crore. The result paired higher sales and earnings with faster growth in cost of goods sold and a rise in working-capital days.
Know Manorama Industries inside out
Results, valuation, peers and who's buying, in one view.
How did Manorama perform in H1FY27?
Manorama reported H1FY27 consolidated revenue of Rs 862.87 crore, compared with Rs 612.86 crore in H1FY26, an increase of 40.8%. Earnings before interest, tax, depreciation and amortisation, or EBITDA, rose 38.0% to Rs 224.39 crore from Rs 162.62 crore, while EBITDA margin moved down 53 basis points to 26.0%.
Profit after tax, or PAT, increased faster than revenue, rising to Rs 159.47 crore from Rs 100.19 crore in H1FY26. PAT margin expanded to 18.5% from 16.3%, a reported improvement of 213 basis points, and diluted earnings per share rose 52.7% to Rs 25.61 from Rs 16.77.
Other income was Rs 25.87 crore in H1FY27, compared with Rs 5.84 crore a year earlier, a 342.7% increase. Finance cost rose 18.4% to Rs 21.28 crore and tax rose 48.1% to Rs 57.04 crore, while earnings before tax after other income increased 56.1% to Rs 216.51 crore.
Why did Manorama’s gross margin decline in H1FY27?
Manorama’s H1FY27 gross profit margin was 43.0%, versus 47.9% in H1FY26, a reported decline of 482 basis points. Cost of goods sold grew 53.8% to Rs 491.5 crore, outpacing the 40.8% increase in revenue, while gross profit increased 26.6% to Rs 371.37 crore.
The gross-margin movement was more pronounced in Q2FY27. Gross profit margin was 42.5%, down 577 basis points year on year from 48.3% in Q2FY26 and down 109 basis points from 43.6% in Q1FY27. Q2 cost of goods sold rose 57.8% year on year to Rs 263.73 crore, compared with Q2 revenue growth of 41.9% to Rs 458.86 crore.
Other expenses increased 8.7% to Rs 106.43 crore in H1FY27, below the 40.8% revenue growth rate, while employee expenses rose 23.5% to Rs 40.54 crore. EBITDA margin declined 53 basis points to 26.0%, a smaller reported change than the 482-basis-point gross-margin decline.
Management said Q2FY27 revenue growth was supported by a stronger mix of value-added offerings and increased utilisation of upgraded fractionation capacity. The presentation does not separately quantify the product-mix effect on H1 gross margin, so faster growth in cost of goods sold is the disclosed numerical difference between revenue and gross-profit growth.
Got a follow-up? Ask IRIS
What changed in Manorama’s working capital and balance sheet?
Manorama’s working-capital analysis increased to 233 days in H1FY27 from 123 days in FY26, following 150 days in FY25. At 30 September 2026, inventories stood at Rs 1,001.2 crore, up from Rs 727.8 crore at 31 March 2026, an increase of Rs 273.4 crore over the six-month period.
Trade receivables rose to Rs 113.5 crore at 30 September 2026 from Rs 62.5 crore at 31 March 2026. Other current assets increased to Rs 116.7 crore from Rs 48.8 crore, while cash, cash equivalents and other bank balances grew to Rs 469 crore from Rs 93.9 crore.
Current borrowings rose to Rs 486.3 crore from Rs 321.8 crore, while non-current borrowings decreased to Rs 30.6 crore from Rs 32.8 crore. Total current liabilities increased to Rs 606.9 crore from Rs 473.2 crore, whereas total equity rose to Rs 1,328 crore from Rs 682.1 crore.
The presentation reported net debt-to-equity of 0.04 in H1FY27, compared with 0.38 in FY26 and 0.83 in FY25. It also reported return on equity of 24.0% for H1FY27, calculated on average shareholders’ equity, versus 39.4% for FY26, and return on capital employed of 30.9%, versus 46.2% in FY26.
How did Manorama’s Q2FY27 compare with the first quarter and prior year?
Manorama’s Q2FY27 revenue was Rs 458.86 crore, 13.6% above Rs 404.01 crore in Q1FY27 and 41.9% above Rs 323.31 crore in Q2FY26. Q2 EBITDA reached Rs 118.18 crore, up 11.3% sequentially and 34.4% year on year, while EBITDA margin declined to 25.8% from 26.3% in Q1FY27 and 27.2% a year earlier.
Q2FY27 PAT was Rs 80.81 crore, 2.7% above Rs 78.66 crore in Q1FY27 and 51.8% above Rs 53.24 crore in Q2FY26. PAT margin was 17.6%, compared with 19.5% in the preceding quarter and 16.5% in Q2FY26, showing that year-on-year margin expansion did not continue sequentially.
Exports accounted for 61% of H1FY27 revenue and domestic sales accounted for 39%, according to the presentation. Management linked its growth plans to expanded capacities, an increasingly diversified global customer base and an expanding value-added portfolio, while describing the Milcoa Innovation & Research Centre as DSIR-certified.
Conclusion
Manorama’s H1FY27 results combined 40.8% revenue growth and 59.2% PAT growth with a changed cost pattern at the gross-profit level. Cost of goods sold rose 53.8%, gross margin declined by a reported 482 basis points and working-capital days reached 233, even as EBITDA grew 38.0% and net debt-to-equity was 0.04.
The next disclosed issue to watch is management’s plan to translate expanded capacities into sustainable growth through higher utilisation, value-added products and global customer diversification. Export revenue was 61% of H1FY27 sales, while inventory of Rs 1,001.2 crore and current borrowings of Rs 486.3 crore at 30 September 2026 provide measurable balance-sheet items for subsequent periods.