










Mindspace mix reaches 59.8% in GCCs, hotels and data centres
Key highlights
- Mindspace's GCC, hotel and data-centre share reached 59.8% in H1 FY27, versus 56.4% in FY25.
- Mindspace's third-party IT / ITeS share declined to 18.8% in H1 FY27 from 21.9% in FY25.
- Mindspace had about 3.4 million square feet in non-office asset classes as of September 30, 2026.
- Mindspace's weighted average lease tenure increased to 9.3 years in FY26 from 8.8 years in FY25.
powered by IRIS
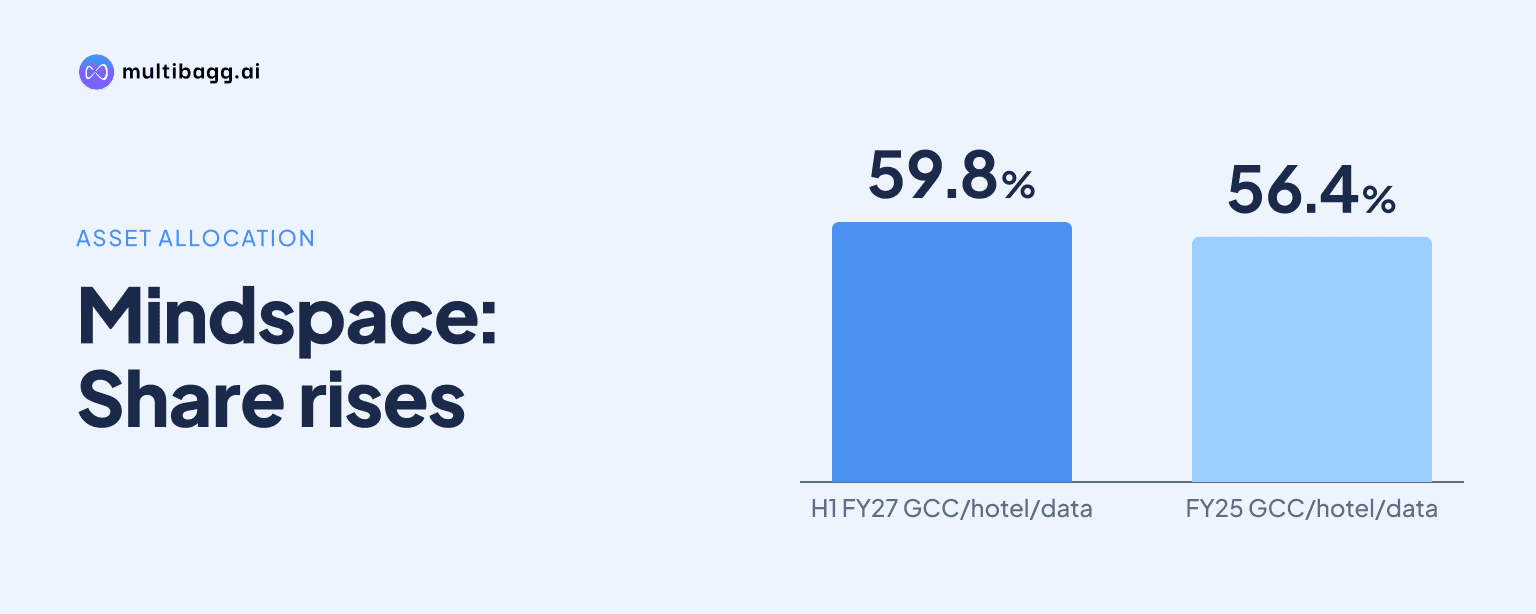
Mindspace Business Parks REIT reported that global capability centres (GCCs), hotels and data centres represented 59.8% of portfolio area, including pre-let space, at the end of H1 FY27, versus 56.4% in FY25. Over the same period, third-party information technology (IT) and information technology-enabled services (ITeS) exposure fell to 18.8% from 21.9%.
Know Mindspace Business Parks REIT inside out
Results, valuation, peers and who's buying, in one view.
How has Mindspace's portfolio mix changed?
Mindspace's combined GCC, hotel and data-centre share rose 3.4 percentage points from FY25 to 59.8% in H1 FY27. GCCs were the largest component at 51.7% of portfolio area, while hotels accounted for 3.7% and data centres for 4.4%.
The movement differed by category over the three reported periods. GCC exposure declined from 53.7% in FY25 to 50.7% in FY26 before recovering to 51.7% in H1 FY27. Hotel exposure increased from 0.4% in FY25 to 2.9% in FY26 and 3.7% in H1 FY27, while data-centre exposure rose from 2.2% to 4.8% before easing to 4.4%.
Mindspace defines third-party IT / ITeS as firms that sell IT services to external clients on a billed basis. Their portfolio share fell 3.1 percentage points from FY25 to H1 FY27, including a 2.4-percentage-point reduction from FY26. The presentation describes the shift toward GCCs, hotels and data centres as part of its plan to build an AI-resilient portfolio.
Why are GCCs central to Mindspace's portfolio strategy?
GCCs are central because they represented 51.7% of Mindspace's portfolio area in H1 FY27 and accounted for 42.9% of India’s gross leasing in the first nine months of calendar 2026. The India-wide GCC leasing share was higher than 37.5% in 2025 and 35.9% in 2024.
India recorded about 61 million square feet of gross leasing in 9M CY2026, with the 42.9% GCC share described in the presentation as a record. More than 200 GCCs entered India during the preceding two years. The presentation says artificial intelligence adoption has not slowed GCC entry or expansion, alongside a shift of strategic, product and research-and-development functions to India.
The cited market data show GCCs occupied more than 278 million square feet of Indian office space in the third quarter of calendar 2026 and represented about 34% of Grade A occupied office stock. The presentation’s CY27 forecast puts GCC office stock above 300 million square feet and the number of GCCs above 2,350, compared with more than 278 million square feet and 2,100-plus GCCs in CY Q3 2026.
Mindspace still recorded positive net leasing from third-party IT / ITeS occupiers despite their lower portfolio share. Net leasing was 293 thousand square feet in FY25, 413 thousand square feet in FY26 and 168 thousand square feet in H1 FY27. The FY26 total was 120 thousand square feet higher than FY25, while H1 FY27 is a partial-period figure.
Got a follow-up? Ask IRIS
What adjacent asset classes does Mindspace own?
Mindspace had about 3.4 million square feet in asset classes other than office as of September 30, 2026, within a total portfolio of about 46.4 million square feet. Data-centre facilities represented about 1.7 million square feet across five data centres, while hospitality represented about 1.4 million square feet across five hotels with about 1,150 keys.
Commercial and office assets remained the main segment at about 43 million square feet. The non-office allocation also included about 0.3 million square feet of food-and-beverage and club assets, comprising Pearl Club, Highstreet and food courts. This leaves the portfolio predominantly office-led despite the addition of adjacent categories.
The presentation links data-centre exposure to digital-infrastructure demand from AI adoption. It says hotel exposure adds a demand driver distinct from traditional office leasing. The reported areas show that data centres, at about 1.7 million square feet, were larger than hospitality, at about 1.4 million square feet, as of September 30, 2026.
The five hotels are located across the Mumbai region, Hyderabad and Pune. Data centres and hospitality together accounted for about 3.1 million square feet of the 3.4 million-square-foot non-office allocation, with food-and-beverage and club assets contributing the remaining 0.3 million square feet.
Is AI affecting Mindspace's leasing commitments or lease terms?
Mindspace reported no visible AI impact on disclosed leasing behaviour, with weighted average lease tenure on gross leasing increasing to 9.3 years in FY26 from 8.8 years in FY25. The measure is weighted by area, includes pre-leases and excludes hotels and data centres.
The 0.5-year increase means the reported gross-leasing term lengthened between FY25 and FY26, despite the presentation noting discussion that AI could shorten occupiers’ planning horizons. Mindspace characterises leasing tenures as stable and long-term oriented on the reported data.
Office-client pre-commitments were 0.8 million square feet, or 22% of gross leasing, in FY24; 2.5 million square feet, or 41%, in FY25; and 1.5 million square feet, or 23%, in FY26. These figures exclude hotels and data centres.
The FY26 pre-commitment share was 18 percentage points below FY25’s 41% but one percentage point above FY24’s 22%. Across India, pre-commitments totalled 9.7 million square feet and 16% of gross leasing in 9M CY2026, compared with 14 million square feet and 17% in 2025. Mindspace says occupiers are pre-committing to large spaces over five to 10 years.
Conclusion
Mindspace's reported portfolio mix shows lower reliance on third-party IT / ITeS occupiers, whose share declined to 18.8% in H1 FY27, while GCCs, hotels and data centres reached 59.8%. GCCs remain the principal component at 51.7%, and the 3.4 million-square-foot non-office allocation gives data centres, hotels, clubs and food-and-beverage assets a defined role alongside about 43 million square feet of commercial and office space.
The next disclosed measures to watch are the CY27 forecast for GCC office stock above 300 million square feet and more than 2,350 GCCs, along with Mindspace’s future pre-commitment share after 23% in FY26. Future weighted average lease-tenure data will also show whether the FY26 increase to 9.3 years persists as the presentation’s stated lack of visible AI impact is tested.