










Mindspace targets Rs 1,700-1,800 crore organic NOI over three years
Key highlights
- Mindspace targets approximately Rs 1,700-1,800 crore of organic NOI addition over the next three years.
- Mindspace identifies 2.9 msf of vacant area and 8.7 msf of development space as organic growth drivers.
- Mindspace lists 3.2 msf of development deliveries for H2 FY27 and 0.9 msf for FY28.
- Mindspace reports portfolio MTM potential of 22.8% and Hyderabad MTM potential of 46.0%.
powered by IRIS
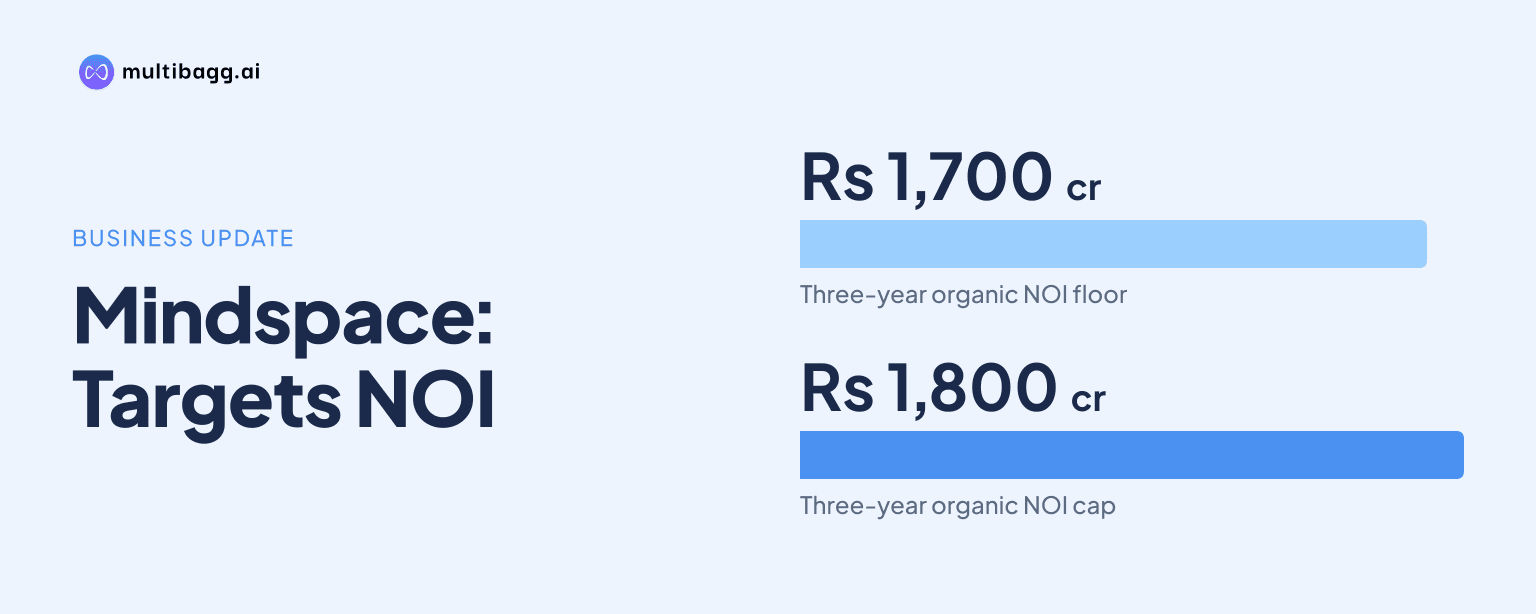
Mindspace Business Parks REIT targets approximately Rs 1,700-1,800 crore of organic net operating income (NOI) addition over the next three years, based on five drivers including leasing 2.9 million square feet (msf) of vacant space and developing 8.7 msf. The estimate uses average current market rents and may change with market conditions.
Know Mindspace Business Parks REIT inside out
Results, valuation, peers and who's buying, in one view.
What is Mindspace's three-year organic NOI target?
Mindspace targets approximately Rs 1,700-1,800 crore of organic NOI addition during the next three years. The presentation identifies five contributors: vacant-area leasing, rent-reversion acquisitions, development deliveries, contractual rental escalations and mark-to-market (MTM) rental growth.
The target is an estimate rather than reported NOI, and its calculation is based on average current market rent estimates. Realised rental levels can change with market conditions, while area under planned development remains subject to approvals. The presentation does not split the Rs 1,700-1,800 crore estimate among the five drivers.
Mindspace frames the plan as organic growth rather than a target dependent solely on further acquisitions. Its identified leasing pool includes 2.9 msf of vacant area, its development pipeline covers 8.7 msf of under-construction and future-development space, and rent-reversion acquisitions cover 7.0 msf.
Which drivers are expected to add Mindspace's NOI?
Mindspace identifies 2.9 msf of vacant-area leasing, 7.0 msf of rent-reversion acquisitions and 8.7 msf of development space as the measurable area base for its organic NOI plan. Contractual escalations and MTM rental growth are the remaining two drivers, although the presentation gives no individual NOI contribution for any of the five categories.
The 7.0 msf rent-reversion acquisition category covers assets acquired after Q1 FY26, including Square 110, Financial District, Ascent Worli, The Square 98, BKC Annexe, Pune IT Building, Commerzone Pallikaranai, One Radial, strata units in Mindspace Madhapur, and Commerzone Yerwada. This links the rent-reversion category to a specified acquired-asset base.
The development category combines area under development and planned development, subject to approvals. Vacant-area leasing concerns currently unoccupied space, while contractual escalations arise from lease terms. The target therefore combines leasing execution, development delivery and rental-rate movement rather than relying on a single mechanism.
When is Mindspace scheduled to deliver development space?
Mindspace lists 3.2 msf of development deliveries in H2 FY27, followed by 0.9 msf in FY28 and 0.8 msf in FY29. It also lists 3.9 msf for FY30 and later, which places part of the 8.7 msf development programme beyond the nearer delivery periods.
The H2 FY27 through FY29 periods account for 4.9 msf of stated delivery, compared with 3.9 msf scheduled for FY30 and later. H2 FY27 is therefore the largest disclosed delivery tranche, at 3.2 msf, while FY28 and FY29 together account for 1.7 msf.
The schedule distinguishes construction and planned-development timing from the broader three-year NOI estimate. Since the 8.7 msf category includes both under-construction and future-development area, approvals and the timing of delivery remain relevant to the development contribution.
Got a follow-up? Ask IRIS
How much rental upside does Mindspace identify?
Mindspace identifies portfolio MTM potential of 22.8%, while Hyderabad MTM potential is 46.0%. Hyderabad's stated figure is therefore 23.2 percentage points above the portfolio measure, although the presentation does not quantify the NOI contribution expected from MTM gains.
The difference between the 46.0% Hyderabad measure and the 22.8% portfolio measure shows that the disclosed rental-repricing opportunity differs across locations. Mindspace bases its overall NOI estimate on average current market rents and states that market conditions may change those assumptions.
Contractual escalations are a separate mechanism from MTM growth. Mindspace consequently identifies recurring escalations, changes in prevailing market rents, leasing of 2.9 msf of vacancy, 7.0 msf of rent-reversion acquisitions and development of 8.7 msf as distinct routes to additional NOI.
How has Mindspace's NAV and DPU growth compared?
Mindspace reported a 17% one-year compound annual growth rate (CAGR) in net asset value (NAV), compared with 15% over the last three years. Distribution per unit (DPU) CAGR was 14% over the last year and 10% over the last three years, calculated on trailing four-quarter DPU excluding a one-off item in Q4 FY25.
The one-year rate exceeded the three-year rate by 2 percentage points for NAV and by 4 percentage points for DPU. The presentation attributes its value-creation record to occupancy growth, rental buoyancy in core markets, acquisitions, redevelopments, and growth avenues in data centres, hotels and clubs.
The reported comparison places the organic NOI target beside a recent record of NAV and DPU growth. However, the presentation does not provide a direct bridge between the Rs 1,700-1,800 crore NOI estimate and future NAV or DPU outcomes.
Conclusion
Mindspace's Rs 1,700-1,800 crore organic NOI objective combines 2.9 msf of vacant-area leasing, 7.0 msf of rent-reversion acquisitions, 8.7 msf of development space, contractual escalations and MTM rental potential of 22.8% across the portfolio. The plan identifies several sources of NOI growth, but does not disclose each driver's expected monetary contribution.
The next items to watch are the 3.2 msf of deliveries scheduled in H2 FY27, followed by 0.9 msf in FY28 and 0.8 msf in FY29, alongside approvals for planned development. Management also states that the NOI estimate relies on average current market rents, making leasing execution and rental conditions material to the outcome.