










Motherson revenue grew 17% annually as leverage hit 0.8x
Key highlights
- Motherson reported FY26 revenue from operations of Rs 126,104 crore and a stated five-year CAGR of 17%.
- Motherson’s FY26 EBITDA was Rs 12,033 crore, with a stated five-year CAGR of 22%.
- Motherson’s leverage ratio reached a record-low 0.8x in March 2026, versus 1.3x in March 2021.
- Motherson spent a record Rs 5,911 crore on capex in FY26 and guided FY27 capex at Rs 6,000 crore, plus or minus 10%.
powered by IRIS
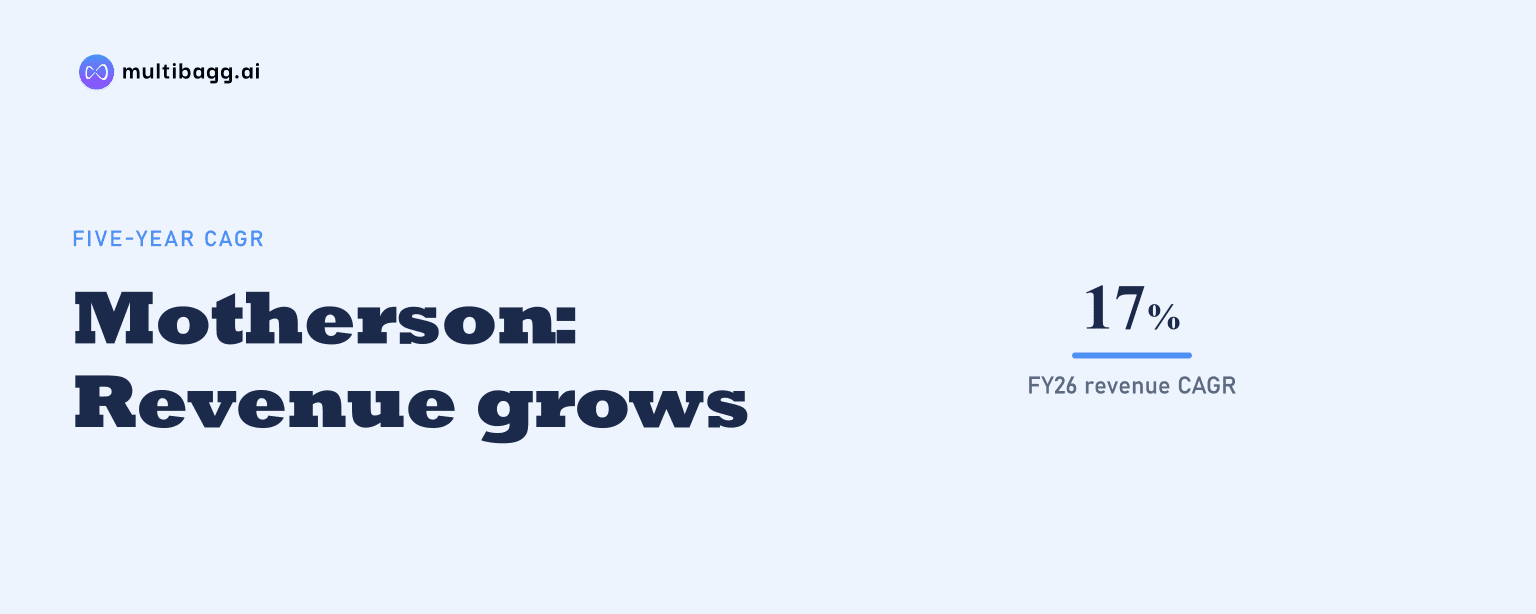
Motherson reported revenue from operations of Rs 126,104 crore in FY26, delivering a stated five-year compound annual growth rate of 17%, while its leverage ratio reached a record low of 0.8x in March 2026. EBITDA grew at a stated 22% five-year CAGR and profit after tax grew at 40%.
Know Samvardhana Motherson International inside out
Results, valuation, peers and who's buying, in one view.
How did Motherson’s revenue, EBITDA and profit change?
Motherson’s revenue from operations increased from Rs 57,370 crore in FY21 to Rs 126,104 crore in FY26, a rise of Rs 68,734 crore over the displayed period. Revenue increased in every year shown: Rs 63,774 crore in FY22, Rs 78,788 crore in FY23, Rs 98,692 crore in FY24 and Rs 113,663 crore in FY25. The presentation states that FY21 and FY22 figures exclude discontinued operations.
Motherson reported EBITDA, or earnings before interest, tax, depreciation and amortisation, of Rs 12,033 crore in FY26, versus Rs 4,516 crore in FY21. Its stated five-year EBITDA CAGR of 22% was higher than the stated 17% revenue CAGR. EBITDA rose from Rs 10,877 crore in FY25 by Rs 1,156 crore in FY26, following increases in each of the prior three financial years shown.
Motherson’s profit after tax, or PAT, concern share rose from Rs 712 crore in FY21 to Rs 3,860 crore in FY26, with a stated five-year CAGR of 40%. The progression was uneven at the start of the period, as PAT declined to Rs 510 crore in FY22 before reaching Rs 1,496 crore in FY23. In FY26, PAT was Rs 57 crore above FY25’s Rs 3,803 crore, while revenue rose by Rs 12,441 crore.
How did Motherson’s debt and leverage change?
Motherson’s leverage ratio declined to 0.8x in March 2026 from 1.3x in March 2021 and 0.9x in March 2025. The company identifies 0.8x as its lowest leverage ratio ever, and its disclosed financial policy is 2.5x. Effective net debt was Rs 9,811 crore in March 2026, only Rs 20 crore above the Rs 9,791 crore reported in March 2025.
The displayed debt series includes a rise before the later reduction. Effective net debt increased from Rs 6,029 crore in March 2021 to Rs 9,137 crore in March 2022 and reached Rs 12,943 crore in March 2024. It then declined by Rs 3,152 crore in March 2025. The leverage ratio peaked at 1.9x in March 2022, then measured 1.4x in both March 2023 and March 2024.
Motherson excludes convertible debenture related debt from the leverage measure because it describes the instrument as mandatorily convertible and without actual debt repayment other than the contracted coupon rate. For acquired assets less than one year old, Motherson uses last-twelve-month EBITDA for like-for-like comparison in FY24 and FY25. Its FY21 and FY22 leverage ratios also exclude debt and EBITDA from discontinued operations.
Got a follow-up? Ask IRIS
Did Motherson keep investing while leverage fell?
Motherson spent a record Rs 5,911 crore on capital expenditure, or capex, in FY26, compared with Rs 4,433 crore in FY25 and Rs 4,010 crore in FY24. FY26 capex represented 49% of EBITDA, up from 41% in FY25 and equal to the 49% ratio reported in FY22. The FY26 capex figure was Rs 3,979 crore higher than the Rs 1,932 crore spent in FY21.
Motherson has guided for FY27 capex of Rs 6,000 crore, plus or minus 10%. Management says approximately 50% is planned for growth capex and 50% for regular capex, while around 60% is planned for non-automotive businesses. This guidance follows FY26 investment of Rs 5,911 crore and coincides with the March 2026 effective net debt level of Rs 9,811 crore.
Motherson lists 17 facilities at different stages of completion, with scheduled start-of-production dates from Q3FY27 to Q4FY28. Projects include wiring-harness capacity in Morocco, wires backward integration in Poland, consumer-electronics capacity and backward integration in India, and wind-power generation in India for captive consumption. The company says all expansion is being undertaken in emerging markets, with some project dates aligned to delayed customer programmes.
What do Motherson’s ROCE figures and 2030 plan show?
Motherson reported return on capital employed, or ROCE, of 16% in FY26, compared with 17% in both FY24 and FY25. The reported measure had increased from 6% in FY21 to 7% in FY22 and 11% in FY23. FY26 ROCE was therefore 10 percentage points above FY21, but one percentage point below the prior two financial years.
Motherson says multiple greenfield facilities were established across geographies for automotive and non-automotive businesses. Its reported capital-employed measure is adjusted for the effect of fair valuation and intangible assets created through the group-wide reorganisation completed on March 31, 2022, as well as capital work in progress and intangible assets under development. These adjustments apply to the reported 16% ROCE in FY26.
Motherson’s Vision 2030 sets a target of USD 108 billion in gross revenues for 2029-30 and group ROCE of 40%. For this plan, group ROCE is defined as earnings before interest and tax divided by average capital employed, including 100% of earnings before interest and tax and capital employed from equity-accounted joint ventures and associates. Motherson says the plan uses a constant-currency conversion based on the FY2025 average exchange rate.
Conclusion
Motherson’s FY21-to-FY26 figures show revenue growth at a stated 17% CAGR, with EBITDA at a faster stated 22% CAGR and PAT at 40%. The leverage ratio declined from 1.3x in March 2021 to 0.8x in March 2026, even as FY26 capex reached Rs 5,911 crore and effective net debt was Rs 9,811 crore.
The next measures to watch are management’s FY27 capex guidance of Rs 6,000 crore, plus or minus 10%, and progress at the 17 facilities scheduled to begin production between Q3FY27 and Q4FY28. Over the longer term, Motherson has set Vision 2030 targets of USD 108 billion in gross revenues and 40% group ROCE for 2029-30, compared with reported ROCE of 16% in FY26.