










Nagpur Bypass traffic rises 19% to 14,085 vehicles a day
Key highlights
- Nagpur Bypass traffic rose 19% year on year to 14,085 vehicles per day in Q2 FY27.
- Nagpur Bypass added 2,227 vehicles per day, the largest absolute increase among five reported assets.
- Cars added 916 vehicles per day, while MAV traffic reached 5,986 vehicles per day in Q2 FY27.
- The supplied pages do not disclose a six-laning approval, project cost, contractor or construction timetable.
powered by IRIS
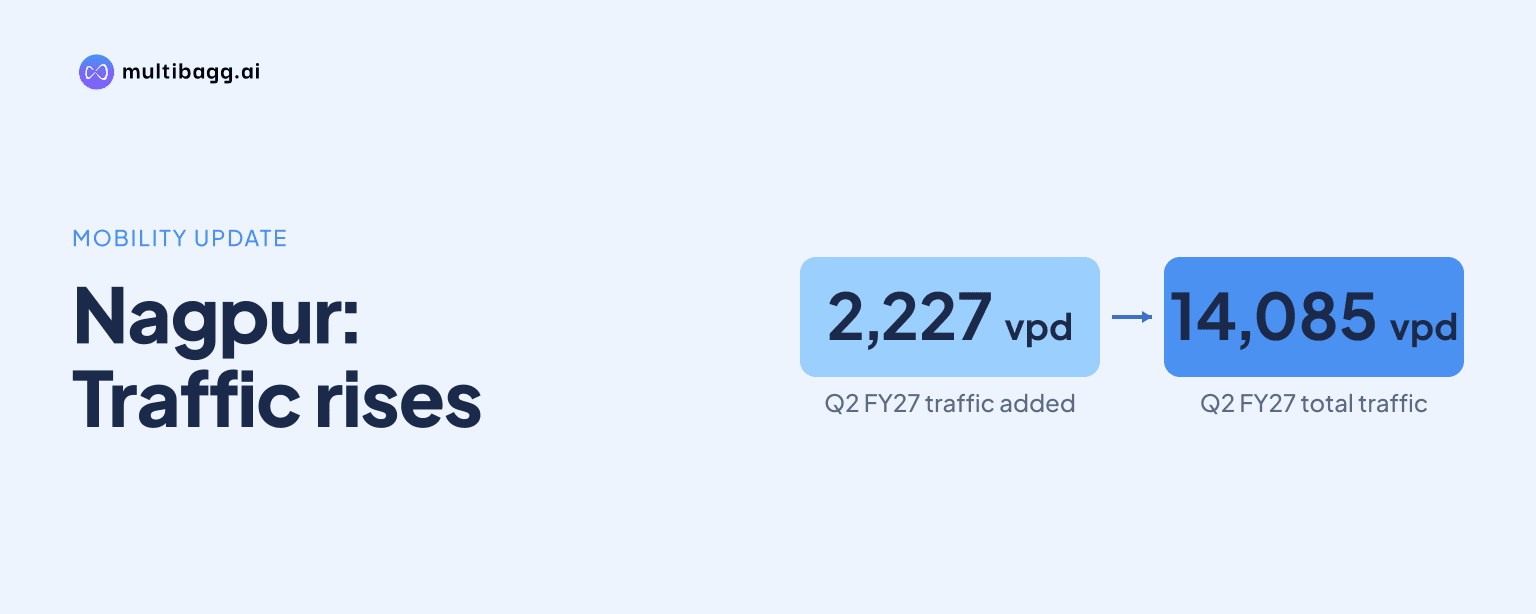
Nagpur Bypass recorded average daily traffic of 14,085 vehicles in Q2 FY27, up 19% from 11,858 in Q2 FY26, with multi-axle vehicles contributing the largest volume at 5,986 a day. The supplied operations report shows growth across every reported vehicle category, but does not disclose six-laning approval, route length, cost or contractor details.
Know Oriental Infra Trust inside out
Results, valuation, peers and who's buying, in one view.
How much did Nagpur Bypass traffic grow in Q2 FY27?
Nagpur Bypass traffic increased by 2,227 vehicles per day, or about 19%, between Q2 FY26 and Q2 FY27. Its Q2 FY27 total of 14,085 vehicles per day was above both the 11,858 recorded a year earlier and the full-year FY26 average of 13,001 vehicles per day.
The increase made Nagpur Bypass the fastest-growing reported asset by percentage among the five portfolio roads shown. Hungund Hospet increased by 1,699 vehicles per day, from 14,786 to 16,485, while Indore Khalghat gained 1,526, from 22,865 to 24,391. Etawah Chakeri rose by 667 vehicles per day and Biaora Dewas by 273, leaving Nagpur Bypass with the largest absolute increase as well as the highest percentage increase.
The portfolio comparison puts the Nagpur Bypass traffic base in context. At 14,085 vehicles per day in Q2 FY27, it remained below Indore Khalghat's 24,391 and Etawah Chakeri's 21,342, but exceeded Biaora Dewas's 11,686. The presentation identifies Nagpur Bypass as a toll project operating across Maharashtra and Madhya Pradesh.
Which vehicle categories drove Nagpur Bypass traffic growth?
Multi-axle vehicles, labelled MAV and defined in the presentation as vehicles with three to six axles, remained the largest Nagpur Bypass category and rose by 722 vehicles per day to 5,986 in Q2 FY27. This category accounted for about 32% of the 2,227-vehicle increase from Q2 FY26, when MAV traffic averaged 5,264 vehicles per day.
Cars delivered the largest increase in vehicle count, rising by 916 vehicles per day from 3,435 to 4,351. Truck and bus traffic added 498 vehicles per day, increasing from 2,556 to 3,054, while light commercial vehicles and mini buses, labelled LCV/Mini Bus, added 89 vehicles per day. The OSV category increased from three to five vehicles per day.
The Q2 FY27 mix shows that commercial categories accounted for substantial traffic volumes. MAV traffic plus truck and bus traffic totalled 9,040 vehicles per day, compared with 7,820 in Q2 FY26, an increase of 1,220. Cars were the largest individual source of growth, although their Q2 FY27 count of 4,351 remained 296 below the FY25 full-year average of 4,647.
Got a follow-up? Ask IRIS
How does Q2 FY27 compare with Nagpur Bypass's prior years?
Nagpur Bypass's Q2 FY27 average of 14,085 vehicles per day was 1,084 above its FY26 average of 13,001 and 1,352 above its FY25 average of 12,733. The Q2 FY27 result therefore exceeded both full-year benchmarks presented in the operations report.
MAV traffic was the largest category in each reported period, rising from 5,132 vehicles per day in FY25 to 5,449 in FY26 and 5,986 in Q2 FY27. Truck and bus traffic followed a similar pattern, increasing from 2,371 in FY25 to 2,634 in FY26 and 3,054 in Q2 FY27. The data show higher volumes in both major commercial-vehicle categories across the reported periods.
Car traffic followed a different path before recovering in Q2 FY27. It declined from 4,647 vehicles per day in FY25 to 4,304 in FY26 and then to 3,435 in Q2 FY26, before increasing to 4,351 in Q2 FY27. The Q2 FY27 car count was 916 above the comparable prior-year quarter but remained below the FY25 and FY26 full-year averages.
What does the presentation say about six-laning and capacity plans?
The supplied Nagpur Bypass pages do not state that the National Highways Authority of India has approved six-laning, nor do they provide a 41.5-kilometre project length. The pages present traffic data by vehicle category for FY25, FY26, Q2 FY26 and Q2 FY27, while the portfolio page classifies Nagpur Bypass as a toll project in Maharashtra and Madhya Pradesh.
The same material does not disclose a project cost, a selected contractor, construction timetable, anticipated completion date, congestion assessment or traffic-diversion risk for Nagpur Bypass. Across the FY25 to Q2 FY27 traffic periods presented, the increase to 14,085 vehicles per day can be reported, but a capacity-expansion approval and its commercial terms cannot be confirmed.
The operations report provides a broader toll-revenue backdrop but does not allocate toll collections to Nagpur Bypass. Consolidated toll revenue was Rs 517.9 crore in Q1 FY27 against Rs 478.7 crore in Q1 FY26, and Rs 500.3 crore in Q2 FY27 against Rs 459.1 crore in Q2 FY26. For the first half, consolidated toll revenue rose 8.6% to Rs 1,018.2 crore from Rs 937.8 crore.
Conclusion
Nagpur Bypass was the portfolio's fastest-growing traffic asset in the Q2 comparison, with average daily traffic rising 19% to 14,085 vehicles. Cars added 916 vehicles per day, MAV traffic added 722 and truck and bus traffic added 498, while the Q2 FY27 total moved above the FY25 and FY26 full-year averages.
The presentation does not disclose a six-laning plan, target, timetable or scheduled construction event for Nagpur Bypass. The unresolved matters to watch are whether subsequent traffic data sustain the Q2 FY27 level of 14,085 vehicles per day and whether later disclosures identify any capacity project, route scope, cost, contractor or completion schedule.