










Nelcast long-term borrowings fall 77% by September 2026
Key highlights
- Nelcast’s long-term borrowings fell from Rs 137.4 crore in Mar’22 to Rs 31.8 crore in Sep’26.
- Consolidated equity increased by Rs 170.0 crore to Rs 614.4 crore between Mar’22 and Sep’26.
- Short-term borrowings were Rs 203.6 crore in Sep’26, down from Rs 220.3 crore in Mar’26.
- Nelcast reported FY26 EBITDA of Rs 124.5 crore and H1FY27 EBITDA of Rs 56.5 crore.
powered by IRIS
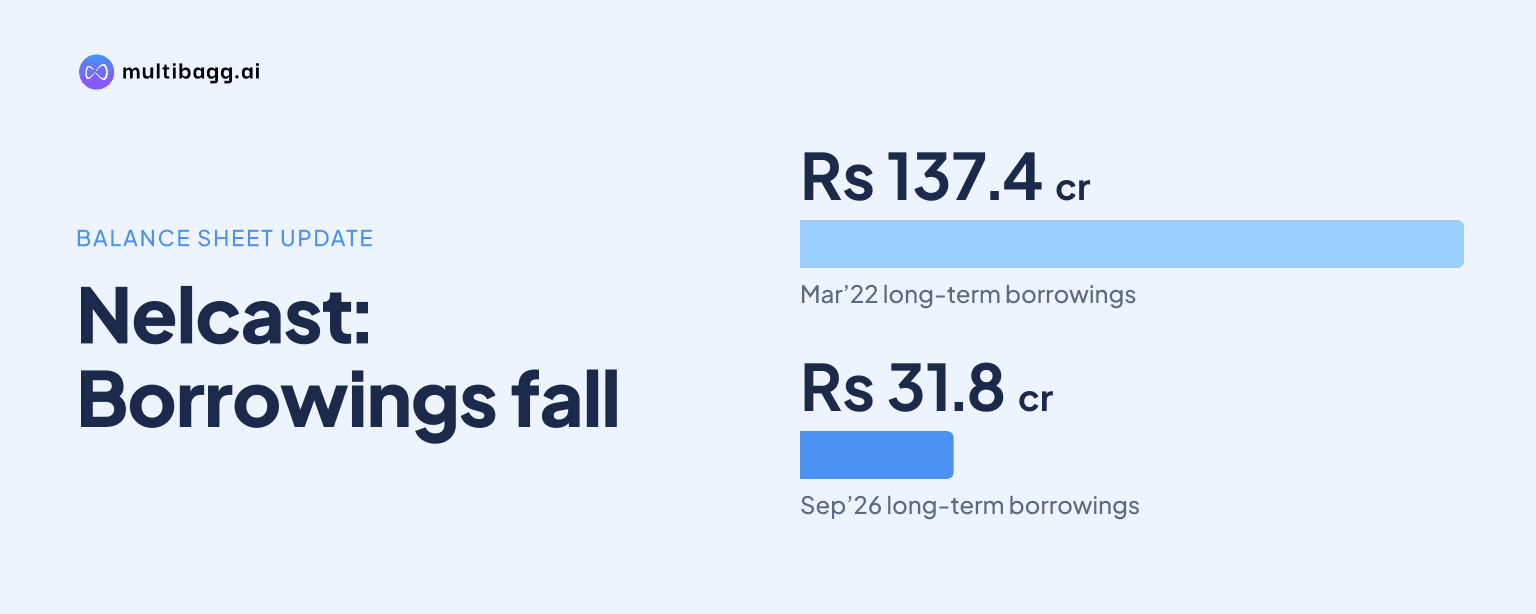
Nelcast Limited reduced long-term borrowings to Rs 31.8 crore in September 2026 from Rs 137.4 crore in March 2022, a Rs 105.6 crore, or 76.9%, decline, while consolidated equity increased to Rs 614.4 crore from Rs 444.4 crore over the same balance-sheet period.
Know Nelcast inside out
Results, valuation, peers and who's buying, in one view.
How did Nelcast’s long-term borrowings change?
Nelcast’s presentation does not identify the repayment or refinancing mechanisms, but it reports lower long-term borrowings in every balance-sheet period from March 2022 through September 2026. The balance declined from Rs 137.4 crore in March 2022 to Rs 100.7 crore in March 2023, Rs 98.0 crore in March 2024, Rs 68.6 crore in March 2025, Rs 36.9 crore in March 2026 and Rs 31.8 crore in September 2026.
The reduction was Rs 105.6 crore across the full period, equal to 76.9% of the March 2022 balance. The largest two-year movement shown was from Rs 98.0 crore in March 2024 to Rs 36.9 crore in March 2026, a Rs 61.1 crore decline, followed by a further Rs 5.1 crore decrease in the six months to September 2026.
What changed in Nelcast’s balance sheet?
Nelcast’s consolidated equity increased by Rs 170.0 crore, reaching Rs 614.4 crore in September 2026 from Rs 444.4 crore in March 2022. Equity was Rs 599.4 crore in March 2026, so it rose another Rs 15.0 crore during the latest six-month period, while total assets increased by Rs 226.5 crore from Rs 963.0 crore to Rs 1,189.5 crore across the longer comparison.
Long-term and short-term funding moved differently. Total non-current liabilities fell from Rs 178.4 crore in March 2022 to Rs 83.7 crore in September 2026, whereas short-term borrowings increased from Rs 142.1 crore to Rs 203.6 crore. Short-term borrowings did decline by Rs 16.7 crore from Rs 220.3 crore in March 2026, but remained above the March 2022 amount.
How did Nelcast’s earnings change as borrowings declined?
Nelcast reported higher revenue from operations, earnings before interest, tax, depreciation and amortisation (EBITDA), and profit after tax (PAT) in FY26 than in FY22. Revenue increased to Rs 1,328.4 crore in FY26 from Rs 927.3 crore in FY22, EBITDA rose to Rs 124.5 crore from Rs 67.5 crore, and PAT increased to Rs 48.4 crore from Rs 14.2 crore. These are full-year profit-and-loss figures, unlike the September 2026 balance-sheet date.
The earnings pattern was uneven between FY22 and FY26. EBITDA reached Rs 106.5 crore in FY24, edged down to Rs 105.6 crore in FY25 and then increased to Rs 124.5 crore in FY26. PAT followed a similar pattern, rising to Rs 54.4 crore in FY24, falling to Rs 37.3 crore in FY25 and recovering to Rs 48.4 crore in FY26.
Finance cost was Rs 25.8 crore in FY22 and Rs 32.5 crore in FY26, so the presentation does not show a lower finance-cost figure across that full-year comparison despite the reduction in reported long-term borrowings. For H1FY27, the first half of FY27, Nelcast reported revenue from operations of Rs 406.0 crore, EBITDA of Rs 56.5 crore, finance cost of Rs 14.0 crore and PAT of Rs 21.3 crore.
Got a follow-up? Ask IRIS
What were Nelcast’s working-capital balances in September 2026?
Nelcast reported total current assets of Rs 658.2 crore at September 2026, comprising trade receivables of Rs 346.2 crore, inventories of Rs 184.4 crore and cash and cash equivalents of Rs 72.2 crore. Compared with March 2026, total current assets decreased by Rs 9.8 crore, receivables by Rs 9.9 crore, inventories by Rs 6.5 crore and cash by Rs 12.6 crore.
Non-current assets were Rs 531.3 crore in September 2026, compared with Rs 530.7 crore in March 2026 and Rs 484.0 crore in March 2022. Trade payables were Rs 258.9 crore in September 2026, down from Rs 266.1 crore in March 2026 but above Rs 180.6 crore in March 2022, while total current liabilities fell to Rs 491.4 crore from Rs 511.4 crore over the latest six months.
What does Nelcast’s September 2026 disclosure leave unresolved?
Nelcast’s September 2026 data confirms a long-term borrowing balance of Rs 31.8 crore, but does not provide a maturity schedule, interest-rate breakdown or stated use of proceeds for long-term or short-term borrowings. The presentation gives balance-sheet totals for six dates without specifying how much of the long-term borrowing change resulted from repayments, refinancing or other transactions.
The operating disclosure also does not provide a full FY27 outcome or forecast. H1FY27 PAT was Rs 21.3 crore and EBITDA was Rs 56.5 crore, compared with FY26 PAT of Rs 48.4 crore and EBITDA of Rs 124.5 crore for the full year. The presentation therefore does not state the revenue, earnings or borrowing balance that will be reported at the March 2027 year-end.
Conclusion
Nelcast’s presentation documents a material change in its consolidated capital structure from March 2022 to September 2026. Long-term borrowings declined by Rs 105.6 crore to Rs 31.8 crore, total non-current liabilities fell by Rs 94.7 crore to Rs 83.7 crore, and equity increased by Rs 170.0 crore to Rs 614.4 crore. Total assets nevertheless rose from Rs 963.0 crore to Rs 1,189.5 crore, while short-term borrowings stood at Rs 203.6 crore.
The next reported milestone is the March 2027 year-end, because the presentation provides only H1FY27 operating figures and the September 2026 balance sheet. That disclosure will show whether the Rs 31.8 crore long-term borrowing balance, Rs 203.6 crore short-term borrowing balance and H1FY27 EBITDA of Rs 56.5 crore changed by the end of FY27.