










Nerolac Q2 revenue rises 19%, while PBDIT margin falls to 9.8%
Key highlights
- Nerolac’s standalone Q2 FY 2026-27 net revenue rose 18.9% to Rs 2,268.77 crore.
- Nerolac’s standalone Q2 PBDIT margin declined to 9.8% from 11.2% a year earlier.
- Nerolac’s standalone Q2 material-cost ratio rose to 70.1% from 65.0% of revenue.
- Nerolac’s H1 FY 2026-27 standalone PBDIT margin was 12.0%, down from 13.0%.
powered by IRIS
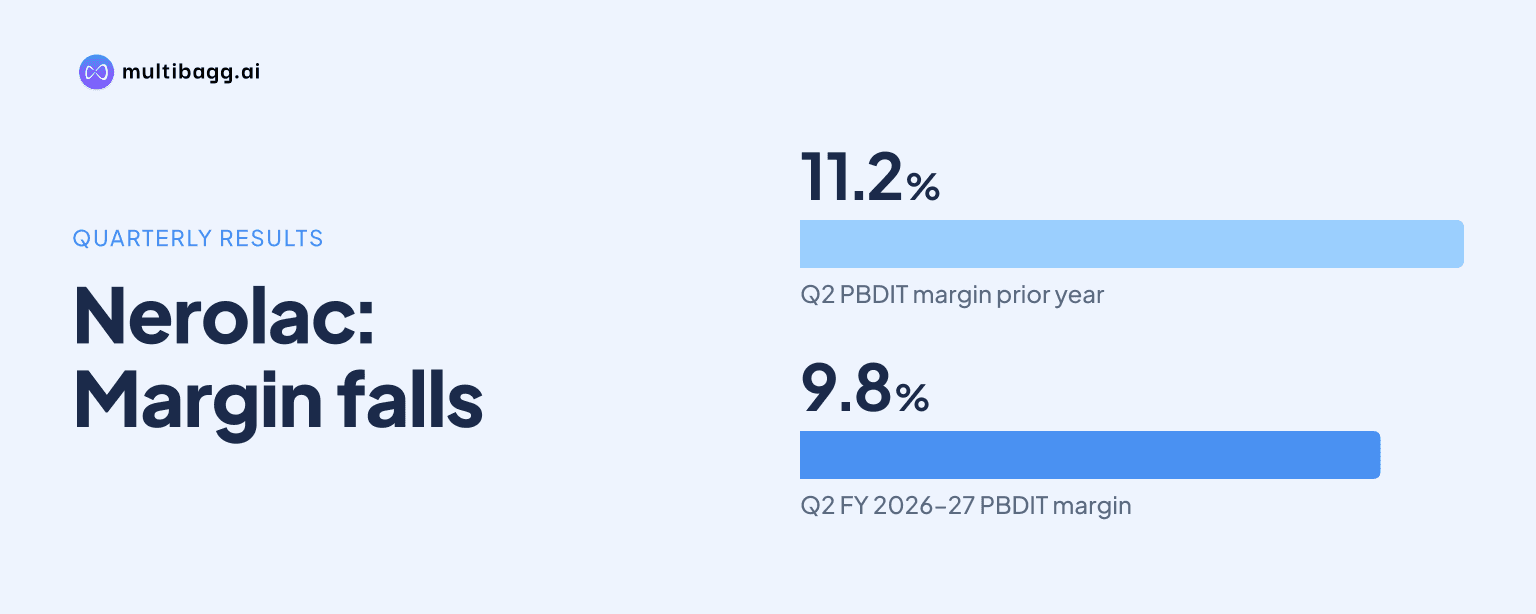
Kansai Nerolac Paints Limited reported standalone Q2 FY 2026-27 net revenue of Rs 2,268.77 crore, up 18.9%, while profit before depreciation, interest and tax (PBDIT) margin fell to 9.8% from 11.2%, as material cost reached 70.1% of revenue versus 65.0% a year earlier.
Know Kansai Nerolac Paints inside out
Results, valuation, peers and who's buying, in one view.
How did Nerolac’s standalone Q2 revenue and profit change?
Nerolac’s standalone revenue and profits increased in Q2 FY 2026-27, although each reported profit measure grew more slowly than sales. Net revenue increased by Rs 361.31 crore year on year to Rs 2,268.77 crore, while PBDIT rose by Rs 10.48 crore to Rs 223.23 crore. The company reported revenue growth of 18.9% and PBDIT growth of 4.9% for the quarter.
Profit before tax (PBT) rose to Rs 191.98 crore in Q2 FY 2026-27 from Rs 184.01 crore in Q2 FY 2025-26, while profit after tax (PAT) rose to Rs 148.64 crore from Rs 136.56 crore. PBT margin declined to 8.5% from 9.6%, and PAT margin declined to 6.6% from 7.2%, tracking the fall in the PBDIT margin.
Why did Nerolac’s Q2 PBDIT margin decline?
Nerolac’s Q2 FY 2026-27 PBDIT margin declined by 1.4 percentage points as material cost took 70.1% of standalone revenue, compared with 65.0% in Q2 FY 2025-26. Material cost increased by Rs 351.15 crore, nearly matching the Rs 361.31 crore increase in revenue. This left a smaller share of sales available for PBDIT despite higher absolute operating profit.
Operating expenses partly offset the increase in material cost as a share of revenue. Standalone operating expenses were Rs 454.79 crore in Q2 FY 2026-27, down Rs 0.32 crore from a year earlier, and their revenue share fell by 3.9 percentage points to 20.0%. That decline was smaller than the 5.1-percentage-point increase in the material-cost ratio, resulting in the 9.8% PBDIT margin.
What does Nerolac’s first-half performance show?
Nerolac’s standalone H1 FY 2026-27 results show the same gap between revenue and operating-profit growth. Net revenue rose 14.2% to Rs 4,601.60 crore, while PBDIT increased 5.8% to Rs 553.11 crore. The H1 PBDIT margin declined to 12.0% from 13.0% in H1 FY 2025-26, a narrower reduction than the Q2 decline.
Material cost was Rs 3,110.59 crore in H1 FY 2026-27, representing 67.6% of revenue, compared with Rs 2,598.26 crore, or 64.5% of revenue, a year earlier. Operating expenses increased to Rs 937.90 crore from Rs 909.80 crore, but their revenue share fell to 20.4% from 22.6%. The 3.1-percentage-point rise in material cost as a share of revenue exceeded the 2.2-percentage-point reduction in operating expenses.
Got a follow-up? Ask IRIS
How did Nerolac’s consolidated results compare with standalone results?
Nerolac’s consolidated Q2 FY 2026-27 revenue was Rs 2,317.38 crore, Rs 48.61 crore above standalone revenue of Rs 2,268.77 crore. Consolidated PBDIT was Rs 224.09 crore, only Rs 0.86 crore above standalone PBDIT, and its margin was 9.7%, compared with 9.8% on a standalone basis. Consolidated revenue grew 18.6% year on year, while consolidated PBDIT grew 4.1%.
The consolidated Q2 material-cost ratio was 69.9%, 0.2 percentage points below the standalone ratio of 70.1%, while consolidated operating expenses represented 14.6% of revenue against 20.0% standalone. Consolidated PAT was Rs 143.99 crore, below standalone PAT of Rs 148.64 crore. In H1 FY 2026-27, consolidated PBDIT margin was 11.8%, down from 12.6% in H1 FY 2025-26.
What risks and outlook has Nerolac disclosed?
Nerolac’s 5 November 2026 presentation identifies sustained high crude oil and derivative prices, currency volatility, and continued West Asia tensions as risks to import costs, procurement planning and supply-chain conditions. The company does not quantify their direct Q2 FY 2026-27 effect, when standalone material cost represented 70.1% of revenue.
Nerolac said the Reserve Bank of India viewed demand conditions as healthy, with activity across construction, mobility and broader domestic demand. Management also said automotive demand could be buoyant because of new launches and festive-period inventory build-up, while inflation may affect discretionary consumer spending. The presentation provides no revenue, margin or earnings target for the remainder of FY 2026-27.
Conclusion
Nerolac delivered 18.9% standalone Q2 FY 2026-27 revenue growth to Rs 2,268.77 crore, but PBDIT increased only 4.9% and its margin fell to 9.8%. The increase in material cost to 70.1% of revenue from 65.0% outweighed the reduction in operating expenses as a share of sales. H1 and consolidated results also recorded revenue growth alongside lower operating margins.
The next reported period will show whether construction, mobility and automotive demand support further revenue growth while material costs remain elevated. Based on the 5 November 2026 presentation, the factors to watch are crude and derivative prices, currency movements, West Asia-related supply-chain conditions, new automotive launches and festive-period inventory build-up.