










NHDC H1 FY27 generation fell 43% as PAT declined 28% year-on-year
Key highlights
- NHDC generated 2,229 MU in H1 FY 26-27, down 43.22% from 3,926 MU in H1 FY 25-26.
- NHDC’s H1 FY 26-27 PAT was Rs 391 crore, down 28.25% from Rs 544.97 crore a year earlier.
- NHDC generated 6,209 MU in FY 2025-26, up from 5,575 MU in FY 2024-25.
- NHDC’s H1 FY 26-27 PAF was 92.13%, compared with 96.71% in H1 FY 25-26.
powered by IRIS
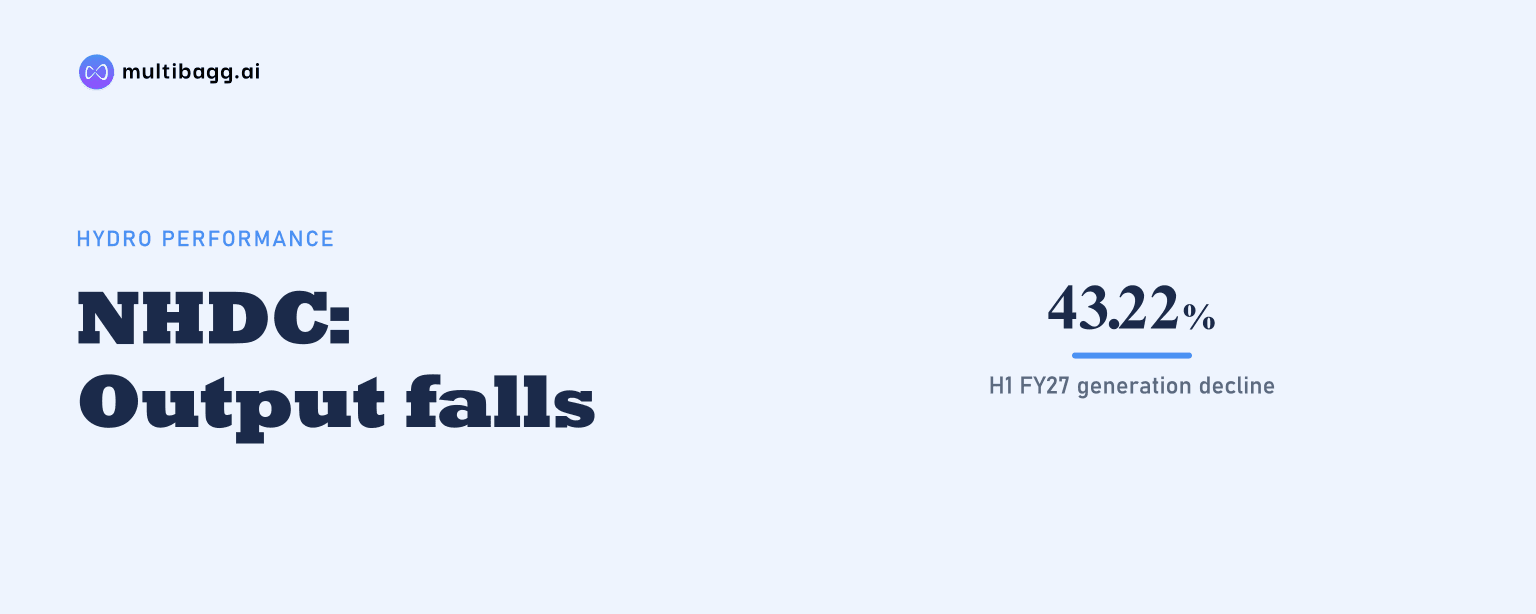
NHDC Ltd. generated 2,229 million units in H1 FY 26-27, 43.22% below 3,926 million units in H1 FY 25-26, while profit after tax fell 28.25% to Rs 391 crore from Rs 544.97 crore. The half-year decline followed NHDC’s highest generation and profit figures in the five-year series shown for FY 2025-26.
Know NHPC inside out
Results, valuation, peers and who's buying, in one view.
Why did NHDC’s H1 FY 26-27 PAT decline?
The presentation does not state an operational cause for the decline, but it reports lower generation, revenue and income in H1 FY 26-27. PAT was Rs 391 crore, down Rs 153.97 crore from Rs 544.97 crore in H1 FY 25-26. Revenue from operations declined by Rs 237.64 crore to Rs 640.80 crore, while total income fell by Rs 239.93 crore to Rs 733.92 crore.
NHDC’s output was 1,697 MU lower year-on-year in the first half, at 2,229 MU compared with 3,926 MU. Actual plant availability factor, or PAF, was 92.13% in H1 FY 26-27, compared with 96.71% in H1 FY 25-26, a reduction of 4.58 percentage points. The presentation reports generation and PAF separately and does not explain the reasons for either movement.
The second quarter had the larger year-on-year reduction in generation. Q2 FY 26-27 output was 1,365 MU, down 58.75% from 3,309 MU in Q2 FY 25-26, whereas the H1 reduction was 43.22%. Q2 revenue from operations declined to Rs 365.18 crore from Rs 640.09 crore, and Q2 PAT fell to Rs 225.15 crore from Rs 407.94 crore.
How did NHDC’s generation and availability change?
NHDC’s H1 FY 26-27 generation and PAF were both below the comparable prior-year period, although Q2 PAF exceeded 100%. H1 generation was 2,229 MU and PAF was 92.13%, compared with 3,926 MU and 96.71%, respectively, in H1 FY 25-26. In Q2 FY 26-27, PAF was 100.33%, versus 107.08% in Q2 FY 25-26.
The full-year figures show that FY 2025-26 had the highest generation in the five financial years displayed. Generation rose to 6,209 MU in FY 2025-26 from 5,575 MU in FY 2024-25, an increase of 634 MU. PAF increased to 97.85% from 96.56% over the same period.
The five-year physical series also shows that annual output has varied despite PAF remaining above 92% in each year shown. Generation was 2,645 MU in FY 2021-22, increased to 5,444 MU in FY 2022-23, fell to 4,473 MU in FY 2023-24, then rose to 5,575 MU in FY 2024-25 and 6,209 MU in FY 2025-26. NHDC’s installed capacity is 1,616 megawatts and its design energy is 2,379 MU.
Got a follow-up? Ask IRIS
How does H1 FY 26-27 compare with NHDC’s FY 2025-26?
H1 FY 26-27 was below the prior half-year across output, revenue, total income and PAT, while FY 2025-26 was the highest year in the supplied five-year generation and PAT data. FY 2025-26 PAT was Rs 935.72 crore, compared with Rs 837 crore in FY 2024-25. H1 FY 26-27 PAT of Rs 391 crore was Rs 544.72 crore below the FY 2025-26 full-year figure, although the periods are not directly comparable because H1 covers six months.
Revenue from operations declined in FY 2025-26 even as output and PAT increased. Sales revenue was Rs 1,305 crore in FY 2025-26, down from Rs 1,401 crore in FY 2024-25, while other income increased to Rs 226 crore from Rs 194 crore. PAT nevertheless rose by Rs 99 crore to Rs 936 crore in the rounded annual snapshot figures.
The H1 movement also differed across income lines. PAF-based incentive was Rs 3.32 crore in H1 FY 26-27, down 74.52% from Rs 13.03 crore in H1 FY 25-26. Secondary energy was Rs 56.46 crore, down 75.15% from Rs 227.16 crore, while deviation charges increased 25.45% to Rs 13.31 crore from Rs 10.61 crore.
What do NHDC’s incentives and ownership structure show?
NHDC reported lower PAF-based incentive and secondary-energy income in H1 FY 26-27, while deviation charges were higher. The Rs 3.32 crore PAF-based incentive represented 7.1% of the Rs 46.66 crore reported for the full FY 2025-26. Secondary energy of Rs 56.46 crore represented 12.0% of the FY 2025-26 amount of Rs 469.93 crore.
The annual snapshot shows these two income components rose in FY 2025-26 from FY 2024-25. PAF incentive increased to Rs 47 crore from Rs 42 crore, and secondary energy rose to Rs 470 crore from Rs 422 crore. Deviation charges were Rs 22 crore in FY 2025-26, compared with Rs 16 crore in FY 2023-24; the supplied snapshot does not provide a FY 2024-25 comparison for this item.
NHDC is held in a 51:49 shareholding structure between NHPC and the Government of Madhya Pradesh. Its regulated equity was Rs 2,082 crore in FY 2025-26. The presentation provides no target, commissioning schedule or operational explanation specific to NHDC beyond the H1 FY 26-27 financial and operating data.
Conclusion
NHDC’s H1 FY 26-27 performance reversed from the higher operating and profit levels recorded in FY 2025-26. Generation fell 43.22% year-on-year to 2,229 MU, revenue from operations declined 27.05% to Rs 640.80 crore, and PAT declined 28.25% to Rs 391 crore. The lower H1 PAF of 92.13%, reduced incentive income and reduced secondary-energy income were reported alongside that outcome.
The next disclosed comparison point is the remaining FY 26-27 period against FY 2025-26, when NHDC generated 6,209 MU and earned PAT of Rs 935.72 crore. Readers can watch whether generation improves from 2,229 MU in H1, whether PAF moves from 92.13%, and whether PAF-based incentive and secondary energy recover from Rs 3.32 crore and Rs 56.46 crore, respectively.