










NHPC H1 PAT rises 21% as finance costs more than double
Key highlights
- NHPC’s H1 FY’27 consolidated PAT rose 20.64% to Rs 2,835.66 crore.
- Revenue from operations increased 26.02% to Rs 8,290.86 crore in H1 FY’27.
- Finance cost increased 115.78% to Rs 1,161.93 crore in H1 FY’27.
- Consolidated hydro generation rose by 2,641 million units to 23,132 million units in H1 FY’27.
powered by IRIS
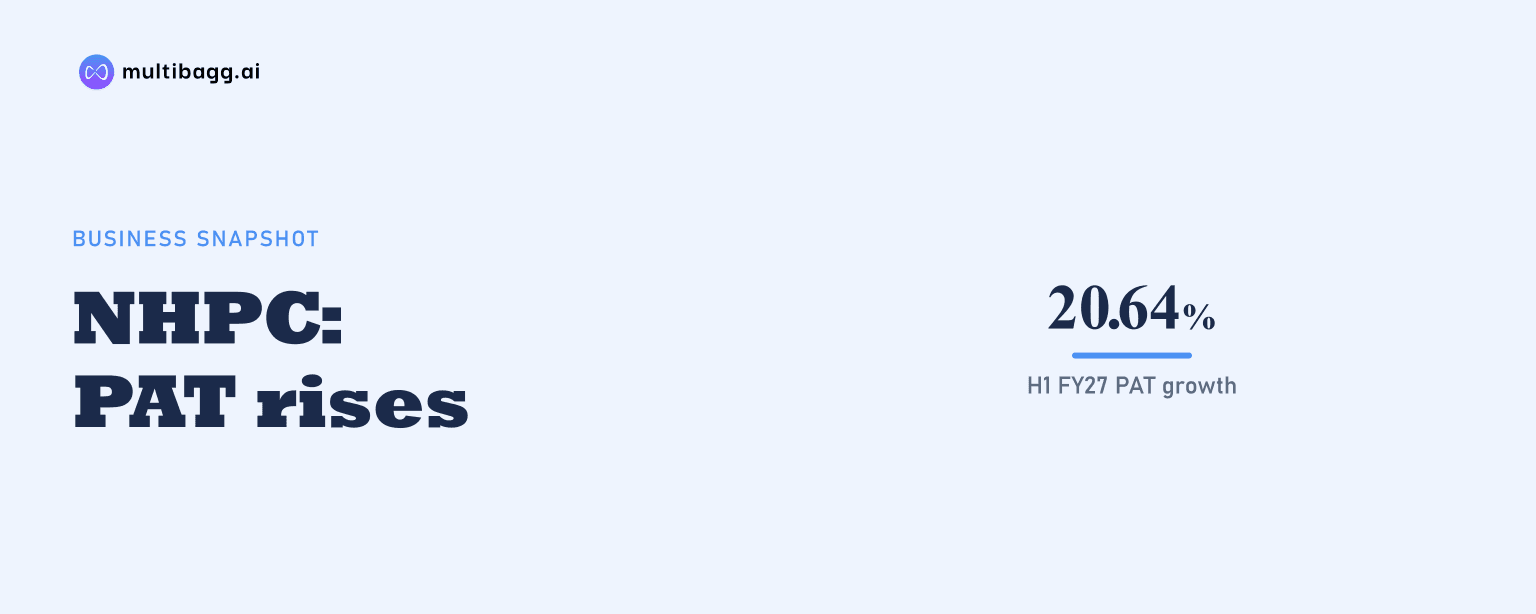
NHPC reported consolidated profit after tax, or PAT, of Rs 2,835.66 crore for H1 FY’27, up 20.64% from Rs 2,350.44 crore in H1 FY’26, as revenue from operations rose 26.02% and rate-regulated income rose 50.16%, despite finance cost increasing 115.78% to Rs 1,161.93 crore.
Know NHPC inside out
Results, valuation, peers and who's buying, in one view.
What drove NHPC’s H1 FY’27 profit increase?
NHPC’s H1 FY’27 profit increase was driven by higher revenue from operations and rate-regulated income. Profit before tax, or PBT, after rate-regulated income increased 14.47% to Rs 3,747.26 crore from Rs 3,273.58 crore, while PAT rose by Rs 485.22 crore year on year.
Total income rose 22.01% to Rs 8,629.30 crore in H1 FY’27, but total expenditure increased faster, by 30.44% to Rs 5,434.51 crore. PBT before rate-regulated income grew 9.97% to Rs 3,196.94 crore, so the Rs 550.32 crore of rate-regulated income was a material contributor to the reported pre-tax result.
NHPC’s share in PAT increased 26.77% to Rs 2,644.96 crore from Rs 2,086.46 crore. The difference between consolidated PAT and NHPC’s share was Rs 190.70 crore in H1 FY’27, compared with Rs 263.98 crore in H1 FY’26.
How did NHPC’s revenue change in H1 FY’27?
NHPC’s revenue from operations rose 26.02% to Rs 8,290.86 crore in H1 FY’27 from Rs 6,579.03 crore a year earlier. The Rs 1,711.83 crore increase in operating revenue exceeded the Rs 1,556.56 crore rise in total income because other income declined by Rs 155.27 crore to Rs 338.44 crore.
Revenue from operations represented 96% of NHPC’s H1 FY’27 total income, while other income accounted for 4%, according to the presentation’s revenue analysis. In H1 FY’26, other income was Rs 493.71 crore, indicating that the period’s income growth came from the operating-revenue line rather than other income.
Rate-regulated income increased by Rs 183.82 crore to Rs 550.32 crore in H1 FY’27. This item lifted PBT from Rs 3,196.94 crore before rate-regulated income to Rs 3,747.26 crore after it, compared with an increase from Rs 2,907.08 crore to Rs 3,273.58 crore in H1 FY’26.
Why did NHPC’s finance cost more than double?
NHPC’s presentation does not specify the cause of the increase in finance cost, but it reports finance cost of Rs 1,161.93 crore in H1 FY’27 against Rs 538.49 crore in H1 FY’26. The Rs 623.44 crore increase equalled 115.78%, and finance cost represented 21% of H1 FY’27 expenditure.
Among the main cost lines, finance cost recorded the largest absolute increase. Depreciation and amortisation rose by Rs 332.45 crore to Rs 1,209.68 crore, other expenses rose by Rs 309.11 crore to Rs 1,717.88 crore, and employee-benefit expense increased by Rs 43.21 crore to Rs 793.17 crore; generation expenses fell by Rs 40.07 crore to Rs 551.85 crore.
NHPC’s consolidated long-term borrowings stood at Rs 50,519.93 crore at H1 FY’27, compared with Rs 46,173.52 crore at FY’26 end. Capital work in progress, including intangible assets under development, increased to Rs 39,074.40 crore from Rs 34,947.58 crore over the same comparison.
Got a follow-up? Ask IRIS
What did NHPC’s Q2 FY’27 result add to the half-year trend?
NHPC’s Q2 FY’27 PAT rose 35.95% to Rs 1,657.57 crore from Rs 1,219.28 crore in Q2 FY’26, faster than the 20.64% increase for H1. Revenue from operations increased 33.20% to Rs 4,482.55 crore, while total income rose 28.64% to Rs 4,669.58 crore.
Q2 finance cost doubled to Rs 556.17 crore from Rs 277.69 crore, an increase of 100.28%. Total Q2 expenditure increased 34.77% to Rs 2,772.98 crore, exceeding income growth, while rate-regulated income rose 61.98% to Rs 296.01 crore.
PBT after rate-regulated income rose 24.97% to Rs 2,193.56 crore in Q2 FY’27 from Rs 1,755.27 crore a year earlier. The tax charge was unchanged at Rs 535.99 crore, and NHPC’s share in PAT increased 51.66% to Rs 1,549.09 crore.
What operating data supports NHPC’s revenue growth?
NHPC’s consolidated hydro generation rose to 23,132 million units in H1 FY’27 from 20,491 million units in H1 FY’26, an increase of 2,641 million units. NHPC’s reported share of country hydro generation increased to 25% from 19%, while country hydro generation fell to 94 billion units from 107 billion units.
Country generation increased to 1,064 billion units in H1 FY’27 from 963 billion units in H1 FY’26. Hydro’s share of country generation consequently declined to 9% from 11%, despite NHPC’s higher consolidated hydro output.
As of 30 September 2026, NHPC had 31 operating power stations with 9,583 megawatts of installed capacity, comprising 24 hydro stations with 9,021 megawatts and seven solar and wind stations with 562 megawatts. It also listed 17 projects under construction with 8,954 megawatts, including 7,764 megawatts of hydro capacity and 1,190 megawatts of solar capacity.
Conclusion
NHPC’s H1 FY’27 outcome combined a 26.02% increase in revenue from operations and a 50.16% rise in rate-regulated income with a 20.64% increase in PAT to Rs 2,835.66 crore. At the same time, total expenditure grew 30.44% and finance cost rose Rs 623.44 crore, placing borrowing-related costs alongside operating revenue as a key part of the earnings picture.
The next reported periods will show how revenue, rate-regulated income and costs develop as NHPC progresses its capacity programme. At 30 September 2026, the company had Rs 39,074.40 crore of capital work in progress, Rs 50,519.93 crore of long-term borrowings and 8,954 megawatts of projects under construction.