










Nisus Finance Services Co. Ltd Q2 income rebounds 35% in FY27
Key highlights
- Nisus Core Q2 FY27 total income was Rs 37.3 crore, up 35% from Q1 FY27.
- Nisus Core Q2 FY27 PAT margin rose 730 basis points sequentially to 43.9%.
- Nisus Core H1 FY27 revenue was Rs 64.8 crore and PAT before minority interest was Rs 26.4 crore.
- UAE AUM was Rs 1,859 crore, or 56% of Nisus Core's Rs 3,304 crore AUM at H1 FY27.
powered by IRIS
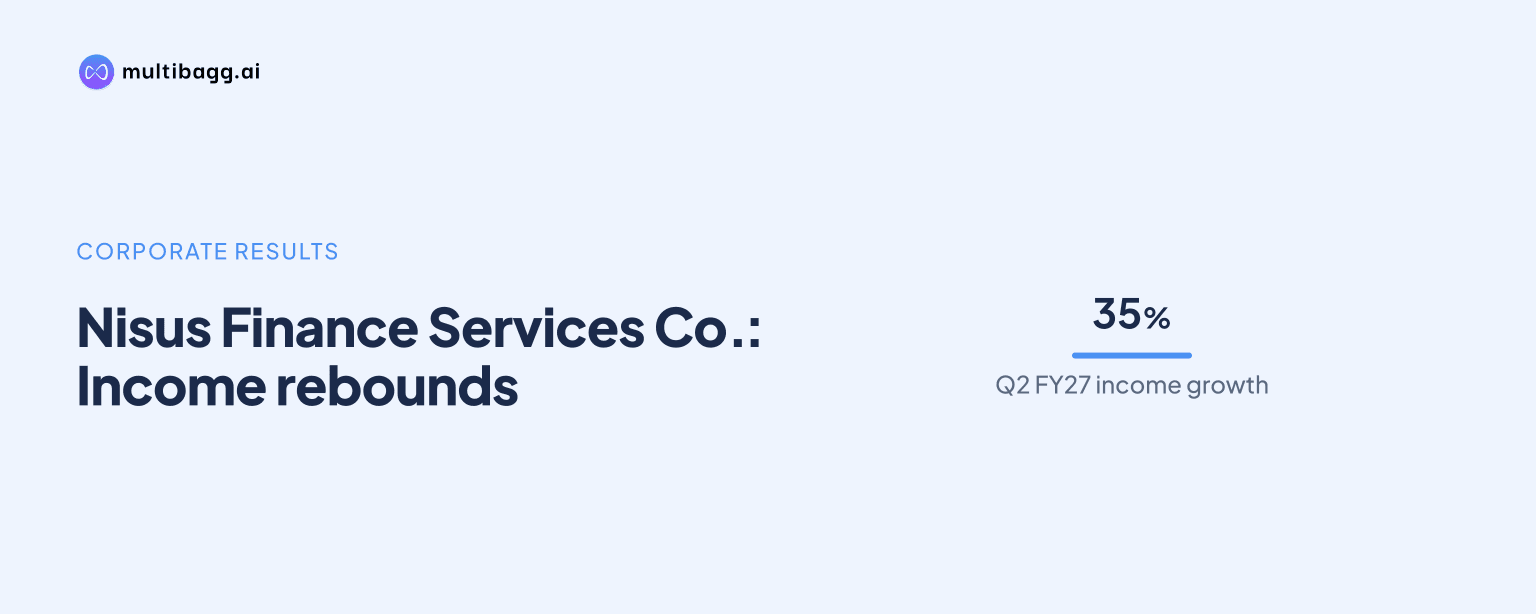
Nisus Finance Services Co. Ltd reported Rs 37.3 crore of Nisus Core income in Q2 FY27, up 35% quarter on quarter, as income increased in India and the UAE recovered after two softer quarters. Nisus Core's profit after tax, or PAT, margin rose 730 basis points to 43.9% from 36.6% in Q1 FY27.
Know Nisus Finance Services Co inside out
Results, valuation, peers and who's buying, in one view.
How did Nisus Core perform in Q2 FY27?
Nisus Core generated Rs 37.3 crore of total income in Q2 FY27, compared with Rs 28 crore in Q1 FY27, according to management's calculation of Q2 as H1 FY27 less Q1 FY27. Management attributed the stated 35% sequential increase to growth in both India and the UAE, with UAE income recovering after two softer quarters.
Nisus Core reported expenses of Rs 17.6 crore, earnings before interest, tax, depreciation and amortisation, or EBITDA, of Rs 24.5 crore, and profit before tax of Rs 19.6 crore in Q2 FY27. It reported PAT before minority interest of Rs 16.4 crore, representing a 43.9% PAT margin, while the presentation states that the calculated Q2 figures are subject to adjustments.
The margin improvement followed the 36.6% PAT margin reported in Q1 FY27. Q2 FY27's 43.9% margin was also above the 40.3% reported in Q4 FY26, although it remained below the 52.1% in Q3 FY26 and 58.7% in Q1 FY26.
Why did UAE income drive Nisus Core's Q2 recovery?
UAE income drove part of Nisus Core's Q2 FY27 recovery because management explicitly cited its rebound, alongside Indian income, in explaining the 35% sequential increase in total income. The presentation provides no separate quarterly UAE revenue figure, so it does not quantify the UAE share of the Q2 income increase.
The UAE was Nisus Core's larger assets under management, or AUM, pool at H1 FY27. UAE AUM stood at Rs 1,859 crore, or 56% of total AUM of Rs 3,304 crore, while India represented Rs 1,445 crore, or 44%. This was a material geographic change from FY24, when all Rs 1,012 crore of AUM was in India, and from FY25, when the UAE represented 29% of Rs 1,572 crore.
Management said H1 FY27 margins were lower in the short term because UAE income had dipped while Nisus Core expanded its UAE team and office. That explanation places the Q2 recovery within a period when the business was adding UAE operating capacity rather than identifying a quantified change in either personnel or office costs.
The presentation assigns different roles to the two markets. Dubai is described as the larger AUM pool, with investments having entry yields of 6.2% to 6.9%, while India drives advisory income. In H1 FY27, transaction advisory generated 68% of revenue and fund management generated 32%.
How did Q2 compare with Nisus Core's first-half earnings?
Nisus Core reported H1 FY27 revenue of Rs 64.8 crore, EBITDA of Rs 41.4 crore and PAT before minority interest of Rs 26.4 crore. Its EBITDA margin was 63.9% and PAT margin was 40.8%, which means the Q2 PAT margin of 43.9% was 3.1 percentage points above the first-half result.
H1 FY27 revenue was 8.2% higher than Rs 59.9 crore in H1 FY26 on management's underlying basis. It was also 7.7% above H2 FY26 revenue of Rs 60.2 crore on that basis. Reported PAT, however, was Rs 26.4 crore in H1 FY27, compared with Rs 36.5 crore in H1 FY26 and Rs 31.2 crore in H2 FY26.
The comparisons need to account for one-time gains recorded in the earlier periods. H1 FY26 included a Rs 15 crore one-time gain in revenue and H2 FY26 included a Rs 6 crore one-time gain. Management separately shows those gains for underlying-income comparisons, while stating that EBITDA and PAT have not been adjusted.
Nisus Core reported Rs 33.2 crore of expenses and Rs 31.6 crore of profit before tax in H1 FY27. Management linked the lower first-half margin to the temporary UAE income decline and the expansion of the UAE team and office, but did not provide a numerical split of these costs.
Got a follow-up? Ask IRIS
What does Nisus Core's revenue mix show?
Nisus Core derived 68% of H1 FY27 revenue from transaction advisory and 32% from fund management, versus 65% and 35%, respectively, in FY26. The three-percentage-point increase in transaction advisory's share occurred while the presentation described India as the advisory-income market and Dubai as the larger AUM base.
The presentation describes investment-banking-services income as fees from deal origination and execution with limited balance-sheet use. Investment-banking services represented 55% of FY26 revenue and 68% of H1 FY27 revenue. Management fees and carry across REAP, RECOF, RESO, the UAE fund and Ni-YAM formed the stated recurring base, with funds accounting for 45% of FY26 revenue and 32% in H1 FY27.
Revenue relative to AUM was 3.9% in H1 FY27, above Nisus Core's stated 3.5% target but below 5.4% in FY26. Management calculated the H1 ratio by annualising Rs 64.8 crore of revenue on closing AUM of Rs 3,304 crore, whereas the FY24 to FY26 ratios used year-end AUM.
The ratio is not solely a management-fee measure because Nisus Core includes investment-banking-services income that is earned on deal closure rather than AUM. Management also cited an indicative alternatives-fee benchmark of 1% to 2%, while noting that its own revenue-to-AUM calculation includes those advisory fees.
What is Nisus Core targeting over the next two to three years?
Nisus Core is targeting AUM of Rs 8,000 crore to Rs 10,000 crore or more over the next two to three years, from Rs 3,304 crore at H1 FY27. Management labels the figures as targets rather than forecasts, and the stated range implies roughly 2.4 to 3 times the H1 FY27 AUM level.
The planned expansion includes structured credit, private equity, commercial real estate, small and medium real estate investment trusts, Dubai International Financial Centre private credit and tokenised funds. Management also identifies three or more geographies as a longer-term ambition, including India, the UAE and exploration in Europe, the Middle East and Africa.
The platform had more than 60 employees at H1 FY27, compared with more than 20 at listing in December 2024, while the presentation targets more than 80. Its construction and engineering, procurement and construction platform, NCCCL, had more than 1,000 employees at H1 FY27, with a target of more than 1,100.
Conclusion
Nisus Core's Q2 FY27 performance showed a sequential earnings recovery, with income rising 35% to Rs 37.3 crore and PAT margin increasing 730 basis points to 43.9%. The improvement reflected contributions from India and a recovery in UAE income, although H1 FY27 reported PAT of Rs 26.4 crore remained below the prior first-half figure that included a Rs 15 crore one-time revenue gain.
The next disclosure to watch is whether UAE income continues to recover as the expanded team and office are absorbed into the cost base. Management's stated plan targets AUM of Rs 8,000 crore to Rs 10,000 crore or more over the next two to three years, supported by additional strategies, including structured credit, private equity and private credit in the Dubai International Financial Centre.