










Nitin Spinners revenue rose 4.2 times as leverage fell
Key highlights
- Nitin Spinners’ revenue increased from Rs 767 crore in FY16 to Rs 3,214 crore in FY26, or about 4.2 times.
- Reported net debt-to-equity declined from 1.71 in FY16 to 0.76 in FY26.
- FY26 PAT rose to Rs 177.6 crore from Rs 175.4 crore in FY25 despite revenue declining to Rs 3,213.9 crore from Rs 3,305.7 crore.
- The company generated about Rs 2,083 crore in cumulative operating cash flow over FY16-FY26 and had gross fixed assets of Rs 2,560 crore in FY26.
powered by IRIS
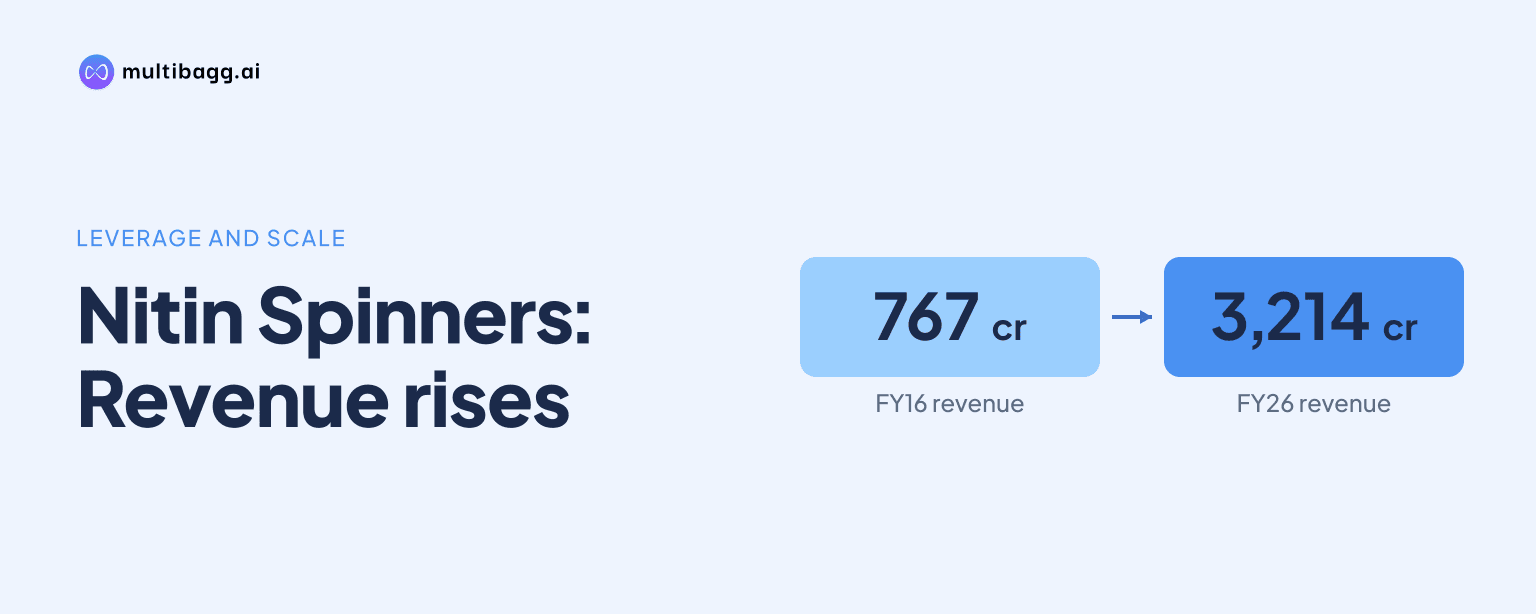
Nitin Spinners Limited increased revenue from Rs 767 crore in financial year 2016 (FY16) to Rs 3,214 crore in FY26, or about 4.2 times, while its reported net debt-to-equity ratio declined from 1.71 to 0.76. Over the same decade, gross fixed assets reached Rs 2,560 crore and cumulative cash flow from operations was about Rs 2,083 crore.
Know Nitin Spinners inside out
Results, valuation, peers and who's buying, in one view.
How much did Nitin Spinners grow over the decade?
Nitin Spinners expanded revenue, earnings before interest, tax, depreciation and amortisation (EBITDA), and profit after tax (PAT) between FY16 and FY26. Revenue rose by Rs 2,447 crore to Rs 3,214 crore, EBITDA increased from Rs 137 crore to Rs 453 crore, and PAT rose from Rs 44 crore to Rs 178 crore.
Nitin Spinners reported a net debt-to-equity ratio of 0.76 in FY26, compared with 1.71 in FY16. The presentation therefore shows that revenue and asset expansion over the decade occurred alongside a 0.95-point reduction in the reported ratio.
Nitin Spinners’ yarn segment rose from Rs 588 crore in FY16 to Rs 2,373 crore in FY26, or about 4.0 times. Its fabric segment increased from Rs 138 crore to Rs 676 crore, or about 4.9 times, meaning fabric recorded the larger growth multiple over the period.
Cash flow from operations increased from Rs 100 crore in FY16 to Rs 411 crore in FY26. Nitin Spinners reported about Rs 2,083 crore of operating cash generation across the 10 years, while gross fixed assets increased by Rs 1,935 crore from Rs 625 crore to Rs 2,560 crore.
What changed in Nitin Spinners’ FY26 performance?
Nitin Spinners’ FY26 revenue and EBITDA declined from FY25, while PAT was the highest in the four-year profit-and-loss series presented. Revenue was Rs 3,213.9 crore in FY26, down from Rs 3,305.7 crore in FY25, whereas PAT increased from Rs 175.4 crore to Rs 177.6 crore.
EBITDA declined to Rs 452.8 crore in FY26 from Rs 471.4 crore in FY25, after rising from Rs 297.1 crore in FY23 and Rs 377.1 crore in FY24. EBITDA margin was 14.09% in FY26, below 14.26% in FY25 but above 12.34% in FY23.
Profit before tax increased to Rs 238.8 crore in FY26 from Rs 237.0 crore in FY25 despite lower revenue. Finance cost declined to Rs 70.9 crore from Rs 90.4 crore, while tax was Rs 61.2 crore compared with Rs 61.5 crore, alongside the Rs 2.2 crore increase in PAT.
The FY26 PAT margin was 5.52%, compared with 5.31% in FY25 and 4.53% in FY24. Nitin Spinners reported earnings per share of Rs 31.58 in FY26 versus Rs 31.20 in FY25, while cash earnings per share increased from Rs 57.48 to Rs 57.93.
Got a follow-up? Ask IRIS
How did Nitin Spinners’ balance sheet and leverage change?
Nitin Spinners reported net debt-to-equity of 0.76 in FY26, compared with 0.89 in FY25, 1.17 in FY24 and 0.95 in FY23. The FY26 reading was also below the FY16 ratio of 1.71, while the four-year series shows the ratio rose in FY24 before declining in the following two years.
Total equity increased to Rs 1,470.7 crore at March 2026 from Rs 1,311.2 crore at March 2025 and Rs 1,028.9 crore at March 2023. Other equity represented Rs 1,414.5 crore of the March 2026 total, while equity share capital remained Rs 56.2 crore across all four balance-sheet dates presented.
Total assets were Rs 2,914.6 crore at March 2026, compared with Rs 2,732.3 crore a year earlier. Non-current assets increased to Rs 1,768.1 crore from Rs 1,607.1 crore and current assets rose to Rs 1,146.5 crore from Rs 1,125.2 crore; property, plant and equipment was Rs 1,489.1 crore at March 2026.
Borrowings comprised Rs 545.2 crore of non-current borrowings and Rs 579.3 crore of current borrowings at March 2026. Compared with March 2025, non-current borrowings declined from Rs 636.7 crore, while current borrowings increased from Rs 528.0 crore; the presentation does not state a net-debt amount.
What is Nitin Spinners planning after FY26?
Nitin Spinners says it plans to double fabric capacity to target higher-margin segments and introduce new high-value products across yarns and fabrics. Its stated fabric-range plan covers formalwear, casualwear, menswear, womenswear and kidswear, including multi-fibre options for women’s apparel and multi-wear categories.
Management also describes continued capital expenditure aimed at improving market share, cost efficiency and production efficiency. Nitin Spinners says its current expansion plan is covered under the Rajasthan Investment Promotion Scheme 2024, which offers incentives for new investments in the state.
Nitin Spinners had renewable power capacity of about 41.4 megawatts and plans to expand solar capacity by about 45 megawatts and hybrid power capacity by about 9 megawatts. Management links the proposed renewable-power investment to lower greenhouse-gas emissions and operating costs; the company also lists organic, Better Cotton Initiative and recycled fibres in its product lines.
Conclusion
Nitin Spinners’ decade record combines revenue growth from Rs 767 crore in FY16 to Rs 3,214 crore in FY26 with a reduction in reported net debt-to-equity from 1.71 to 0.76. Yarn revenue reached Rs 2,373 crore and fabric revenue Rs 676 crore, while the company reported about Rs 2,083 crore of cash flow from operations over the 10-year period.
The next disclosed items to watch are execution of the plan to double fabric capacity, the introduction of higher-value yarn and fabric products, and additions of about 45 megawatts of solar capacity and about 9 megawatts of hybrid capacity. Management has also identified disciplined capital expenditure and Rajasthan Investment Promotion Scheme 2024 coverage as elements of its current expansion plan.