










Kopran Limited reports 58% of HY27 formulations sales in South Africa
Key highlights
- Kopran reported Rs 81.77 crore of HY 2026-27 formulations sales from South Africa, equal to nearly 58% of the Rs 141.31 crore total.
- Kopran's Pen Plant generated Rs 78.14 crore in HY 2026-27, compared with Rs 63.17 crore from the Non Pen Plant.
- Africa and South Africa together contributed Rs 122.31 crore, or about 86.6%, of HY 2026-27 formulations sales.
- South Africa supplied Rs 53.31 crore, or about 63.3%, of Kopran's Rs 84.22 crore Q2 FY 2026-27 formulations sales.
powered by IRIS
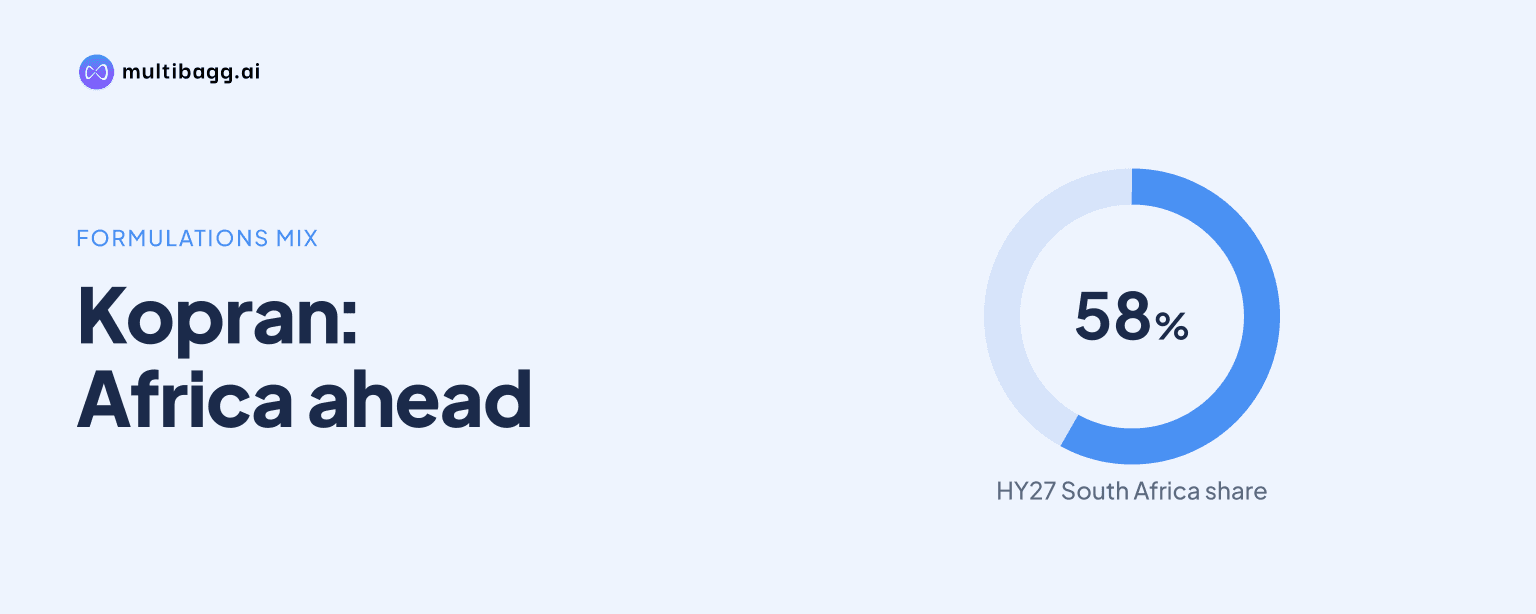
Kopran reported Rs 81.77 crore of HY 2026-27 formulations sales from South Africa, nearly 58% of its Rs 141.31 crore total, while the Pen Plant contributed Rs 78.14 crore, or about 55%. The half-year data therefore shows concentration in both a single country and one reported plant category.
Know Kopran inside out
Results, valuation, peers and who's buying, in one view.
How concentrated were Kopran's HY 2026-27 formulations sales?
South Africa accounted for about 57.9% of Kopran's Rs 141.31 crore formulations sales in HY 2026-27, based on the Rs 81.77 crore reported for that market. It was the largest listed geography, ahead of Africa at Rs 40.54 crore and Southeast Asia at Rs 14.94 crore.
The Pen Plant contributed Rs 78.14 crore, or about 55.3%, of HY formulations sales, while the Non Pen Plant supplied Rs 63.17 crore, or about 44.7%. South Africa's Rs 81.77 crore was Rs 3.63 crore above the Pen Plant amount, although the two figures are separate regional and product-wise views of the same formulations total.
Kopran does not disclose a country-by-plant matrix for the Rs 141.31 crore formulations business. As a result, the presentation does not show how much of South Africa's Rs 81.77 crore came from the Pen Plant, nor how much came from the Non Pen Plant.
Which regions generated Kopran's formulations sales outside South Africa?
Africa was Kopran's second-largest reported formulations region in HY 2026-27 at Rs 40.54 crore, followed by Southeast Asia at Rs 14.94 crore. The two regions together generated Rs 55.48 crore, which was below South Africa's Rs 81.77 crore.
Latem contributed Rs 2.27 crore and Middle East and North Africa contributed Rs 1.13 crore during HY 2026-27. The UK generated Rs 42 lakh and Canada generated Rs 25 lakh, taking the five regions outside South Africa, Africa and Southeast Asia to Rs 19.01 crore in aggregate.
Africa and South Africa together supplied Rs 122.31 crore, or about 86.6%, of Kopran's Rs 141.31 crore formulations sales for the half year. The presentation lists Africa and South Africa separately, so the calculation treats the Rs 40.54 crore Africa figure as distinct from the South African amount.
How did the Pen Plant and Non Pen Plant mix compare?
The Pen Plant was the larger reported product-wise category in HY 2026-27, with Rs 78.14 crore of revenue against Rs 63.17 crore from the Non Pen Plant. The Rs 14.97 crore difference made the Pen Plant the source of a little over half of the half-year formulations total.
In Q2 FY 2026-27, the Pen Plant generated Rs 46.78 crore and the Non Pen Plant generated Rs 37.44 crore, from a total of Rs 84.22 crore. The Pen Plant's calculated share was about 55.5% in Q2, marginally above its approximately 55.3% share in HY 2026-27.
The operational presentation labels the two categories as Pen Plant and Non Pen Plant and does not identify individual medicines, volumes or selling prices. It also provides no plant-level costs, margins, capacity utilisation or profit figures for the Rs 78.14 crore and Rs 63.17 crore HY amounts.
Got a follow-up? Ask IRIS
What changed in Kopran's Q2 FY 2026-27 formulations mix?
South Africa represented about 63.3% of Kopran's Q2 FY 2026-27 formulations sales, higher than its approximately 57.9% share for HY 2026-27. Sales from South Africa were Rs 53.31 crore in Q2, out of a quarterly formulations total of Rs 84.22 crore.
Africa generated Rs 19.70 crore in Q2 and Southeast Asia contributed Rs 7.96 crore. Latem added Rs 1.80 crore, Middle East and North Africa contributed Rs 79 lakh, the UK supplied Rs 42 lakh and Canada supplied Rs 24 lakh, leaving South Africa above all other listed regions combined at Rs 30.91 crore.
Q2 accounted for Rs 84.22 crore, or about 59.6%, of the Rs 141.31 crore reported for HY 2026-27. Its Rs 53.31 crore of South African sales represented about 65.2% of the half-year South Africa total, while Q2 Pen Plant revenue of Rs 46.78 crore represented about 59.9% of the HY Pen Plant amount.
These are comparisons between a quarter and the half year that includes that quarter, rather than year-on-year growth measures. The presentation does not provide Q1 regional or plant-category values directly, but the difference between HY and Q2 implies Rs 28.46 crore of South African formulations sales and Rs 31.36 crore of Pen Plant revenue outside Q2.
Conclusion
Kopran's HY 2026-27 formulations revenue was concentrated in South Africa and the Pen Plant category. South Africa supplied Rs 81.77 crore of the Rs 141.31 crore total, while the Pen Plant generated Rs 78.14 crore; Africa and South Africa together accounted for Rs 122.31 crore of reported formulations sales.
What to watch next is whether subsequent disclosures show a change in the regional or plant mix. The presentation provides neither a diversification target nor a country-by-plant sales breakdown, leaving unresolved whether the Q2 concentration of Rs 53.31 crore in South Africa reflects a continuing pattern or a period-specific sales mix.