










Kopran Q2 revenue rises 79% as net profit returns year-on-year
Key highlights
- Kopran reported Q2 FY 2026-27 consolidated revenue of Rs 211.26 crore, up 79% from Rs 117.91 crore a year earlier.
- Q2 FY 2026-27 net profit was Rs 4.39 crore, versus a Rs 9.92 crore loss in Q2 FY 2025-26.
- Kopran’s Q2 EBITDA margin was 8.62%, below Q1 FY 2026-27’s 10.31% but above 2.53% a year earlier.
- Q2 FY 2026-27 API revenue was Rs 123.21 crore, including Rs 87.45 crore of local sales and Rs 35.76 crore of exports.
powered by IRIS
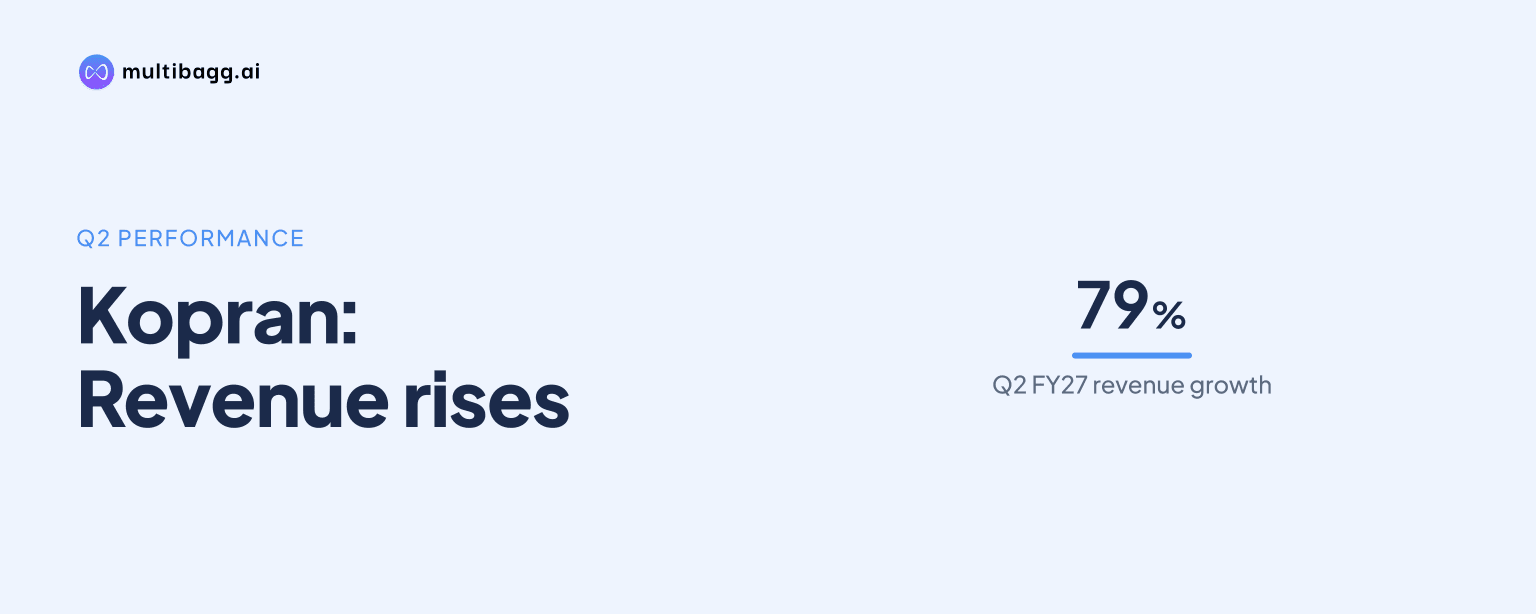
Kopran Limited reported consolidated Q-2 2026-27 revenue from operations of Rs 211.26 crore, 79% above Q-2 2025-26, and net profit of Rs 4.39 crore against a Rs 9.92 crore loss; its EBITDA margin was 8.62%, above 2.53% a year earlier but below Q-1’s 10.31%.
Know Kopran inside out
Results, valuation, peers and who's buying, in one view.
How did Kopran perform in Q2 FY 2026-27?
Kopran’s consolidated revenue from operations rose to Rs 211.26 crore in Q-2 2026-27 from Rs 117.91 crore in Q-2 2025-26, an increase of about 79%. Earnings before interest, tax, depreciation and amortisation (EBITDA) increased to Rs 18.22 crore from Rs 2.99 crore, while net profit moved to Rs 4.39 crore from a loss of Rs 9.92 crore. The reported EBITDA figure excludes other income and foreign-exchange losses.
The Q2 improvement was also visible in EBITDA margin, which rose by 6.09 percentage points from 2.53% in Q-2 2025-26 to 8.62% in Q-2 2026-27. Finance costs were Rs 4.25 crore against Rs 2.09 crore a year earlier, depreciation was Rs 5.89 crore against Rs 4.28 crore, and tax expense was Rs 1.50 crore compared with a tax credit of Rs 1.70 crore in the prior-year quarter.
Why did Kopran return to net profit in Q2?
Kopran’s presentation does not state the operating reasons for its return to reported net profit in Q-2 2026-27. It reports EBITDA of Rs 18.22 crore against Rs 2.99 crore a year earlier and revenue of Rs 211.26 crore, alongside the change from a Rs 9.92 crore loss in Q-2 2025-26 to Rs 4.39 crore of profit.
The comparison also includes a changed foreign-exchange position: Kopran recorded a foreign-exchange loss of Rs 2.19 crore in Q-2 2026-27, compared with a loss of Rs 8.24 crore in Q-2 2025-26. Because Kopran defines EBITDA as excluding other income and foreign-exchange losses, EBITDA improvement and the final net-profit comparison do not provide a direct one-line reconciliation.
For the first half-year, or HY, of FY 2026-27, Kopran reported revenue from operations of Rs 365.26 crore, versus Rs 253.13 crore in HY 2025-26. HY EBITDA increased to Rs 34.10 crore from Rs 17.09 crore, while HY net profit was Rs 11.10 crore after a Rs 2.47 crore loss in the corresponding prior-year half.
Got a follow-up? Ask IRIS
How did Kopran’s Q2 compare with the previous quarter?
Kopran’s Q2 revenue was Rs 211.26 crore, up about 37% from Rs 153.99 crore in Q-1 2026-27, but its EBITDA margin declined to 8.62% from 10.31%. EBITDA nevertheless increased by about 15% quarter on quarter, from Rs 15.88 crore to Rs 18.22 crore, alongside the higher revenue.
Net profit moved in the opposite direction from revenue, declining from Rs 6.70 crore in Q-1 2026-27 to Rs 4.39 crore in Q-2 2026-27. In the same comparison, finance costs rose from Rs 3.28 crore to Rs 4.25 crore, depreciation rose from Rs 5.77 crore to Rs 5.89 crore, and the foreign-exchange line changed from a Rs 1.98 crore gain to a Rs 2.19 crore loss.
The Q2 margin was 1.69 percentage points below Q-1 despite being 6.09 percentage points above the year-earlier quarter. For HY 2026-27, EBITDA margin was 9.34%, compared with 6.83% in HY 2025-26 and 11.48% for FY 2025-26, placing the half-year result between those two reported periods.
What did Kopran’s API revenue mix show in Q2?
Kopran reported active pharmaceutical ingredients, or API, revenue of Rs 123.21 crore in Q2 FY 2026-27, comprising Rs 87.45 crore of local sales and Rs 35.76 crore of export sales. Local sales accounted for about 71% of the Q2 API market-wise total, while exports accounted for about 29%; these operating figures are presented separately from consolidated revenue from operations.
For HY 2026-27, API revenue was Rs 218.59 crore, consisting of Rs 144.22 crore in local sales and Rs 74.37 crore in exports. Q2 API revenue represented about 56% of that HY total, while Q2 local sales exceeded export sales by Rs 51.69 crore.
The Q2 API segment-mix chart identifies 11 therapeutic or product categories and reports a total of Rs 123.21 crore. The categories include anti-diabetic, anti-infective, anti-hypertensive, anti-thrombotic, central nervous system, carbapenem, intermediate, macrolide, anti-urological, neuromodulator and non-steroidal anti-inflammatory drug products; the presentation does not provide a written narrative linking individual chart values to those categories.
Conclusion
Kopran’s Q2 FY 2026-27 results show a year-on-year earnings turnaround: revenue increased from Rs 117.91 crore to Rs 211.26 crore, EBITDA rose from Rs 2.99 crore to Rs 18.22 crore, and net profit replaced a Rs 9.92 crore loss with Rs 4.39 crore of profit. The sequential picture was mixed, with Q2 revenue above Q-1 but EBITDA margin 1.69 percentage points lower.
Kopran does not disclose a revenue, EBITDA-margin or profit target, and the presentation gives no date for the next financial update. The unresolved point for future disclosures is whether revenue above Rs 200 crore can coincide with a margin above Q2’s 8.62%, given that Q-1 2026-27 margin was 10.31% and the presentation does not explain the Q2 change.