










Kopran assets and borrowings rise as returns and profit retreat
Key highlights
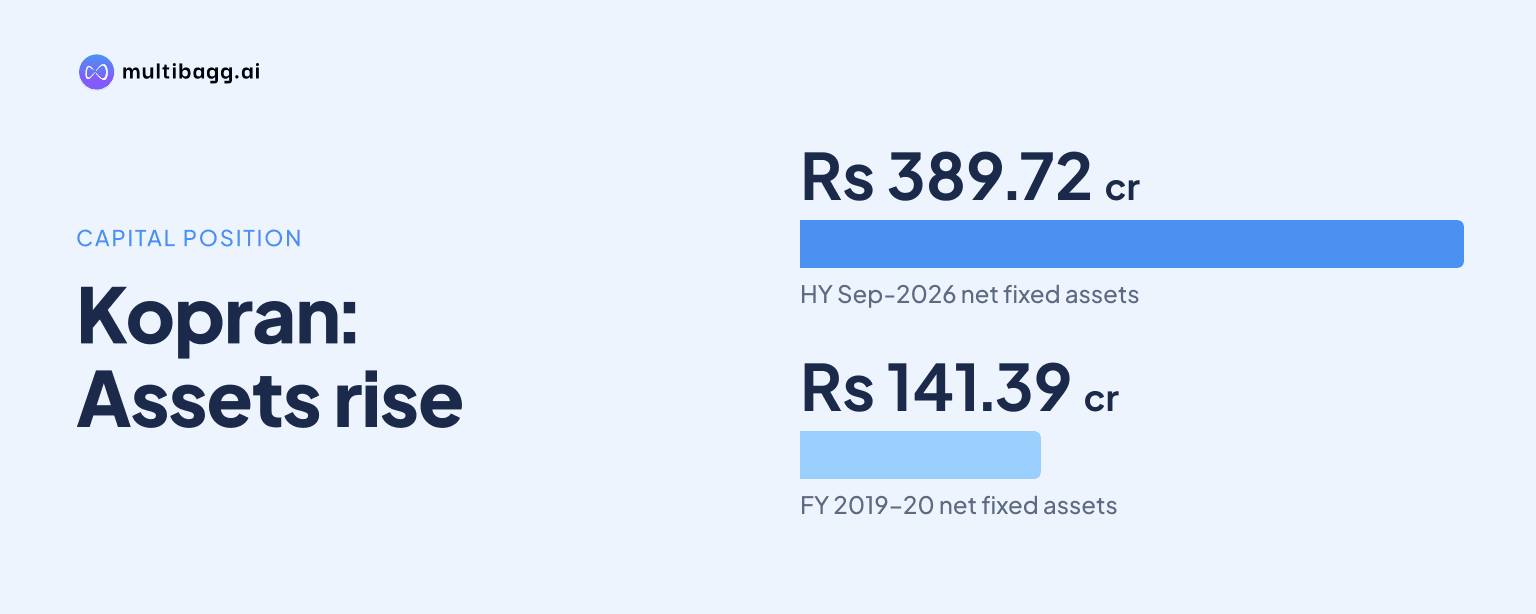
- Kopran’s net fixed assets rose to Rs 389.72 crore at HY Sep-2026 from Rs 141.39 crore in FY 2019-20.
- Kopran’s borrowings were Rs 208.37 crore at HY Sep-2026, versus Rs 152.69 crore in FY 2025-26.
- Kopran’s RoE declined to 4.9% in FY 2025-26 from a 28.3% peak in FY 2020-21.
- Kopran’s FY 2025-26 net profit was Rs 25.73 crore, compared with Rs 61.61 crore in FY 2020-21.
powered by IRIS
Kopran Limited reported net fixed assets of Rs 389.72 crore and borrowings of Rs 208.37 crore at HY Sep-2026, while return on equity was 2.1%, versus a 28.3% annual peak in FY 2020-21; FY 2025-26 net profit was Rs 25.73 crore.
Know Kopran inside out
Results, valuation, peers and who's buying, in one view.
How much have Kopran’s fixed assets increased?
Kopran’s net fixed assets increased by Rs 248.33 crore between FY 2019-20 and HY Sep-2026, reaching Rs 389.72 crore from Rs 141.39 crore. The asset base was Rs 371.24 crore in FY 2025-26, compared with Rs 321.60 crore in FY 2024-25 and Rs 278.30 crore in FY 2023-24. Net fixed assets rose in each of these reported periods.
At HY Sep-2026, fixed assets were equivalent to about 74% of the Rs 527.97 crore net worth reported by Kopran. In FY 2019-20, the corresponding figures were Rs 141.39 crore of fixed assets and Rs 189.68 crore of net worth. Net worth rose through FY 2025-26, but was Rs 2.31 crore lower at HY Sep-2026 than at the FY 2025-26 reporting date.
How have Kopran’s borrowings and finance costs changed?
Kopran’s borrowings rose to Rs 208.37 crore at HY Sep-2026, compared with Rs 78.06 crore in FY 2019-20 and Rs 152.69 crore in FY 2025-26. The increase from FY 2025-26 coincided with net fixed assets rising from Rs 371.24 crore to Rs 389.72 crore over the same reporting dates. The presentation reports borrowings but does not state their purpose or maturity profile.
Finance costs increased to Rs 10.47 crore in FY 2025-26 from Rs 5.12 crore in FY 2021-22, when borrowings were Rs 72.48 crore. At HY Sep-2026, finance costs were Rs 7.54 crore for the half-year, alongside Rs 208.37 crore of borrowings. As HY Sep-2026 is a partial period, its finance-cost figure is not directly comparable with full-year totals without annualisation, which the presentation does not provide.
The net debt-to-equity ratio, expressed in times, moved from 0.04x in FY 2021-22 to 0.27x in FY 2025-26 and 0.38x at HY Sep-2026. It was 0.39x in FY 2019-20. This ratio differs from reported borrowings because it uses net debt, while the presentation does not provide a cash balance to reconcile net debt with gross borrowings.
Got a follow-up? Ask IRIS
How have Kopran’s return ratios changed from earlier highs?
Kopran’s return on equity, or RoE, fell to 4.9% in FY 2025-26 from 28.3% in FY 2020-21, while return on capital employed, or RoCE, declined to 9.2% from 25.3% over the same comparison. The presentation defines RoE as return on net worth or equity and RoCE as return on capital employed. The presentation reports these ratios but does not assign a specific reason for their changes.
The FY 2023-24 recovery did not continue in the following two annual periods. RoE declined from 11.0% in FY 2023-24 to 7.6% in FY 2024-25 and 4.9% in FY 2025-26; RoCE moved from 11.5% to 9.4% and then 9.2%. At HY Sep-2026, Kopran recorded RoE of 2.1% and RoCE of 1.9% for the half-year.
What happened to Kopran’s profit and operating margins?
Kopran’s FY 2025-26 net profit was Rs 25.73 crore, down from Rs 38.55 crore in FY 2024-25 and Rs 50.96 crore in FY 2023-24. The highest annual profit in the displayed record was Rs 61.61 crore in FY 2020-21, narrowly above Rs 61.03 crore in FY 2021-22. Earnings per share followed the same direction, declining to Rs 5.33 in FY 2025-26 from Rs 14.24 in FY 2020-21.
Sales and other income rose to Rs 681.77 crore in FY 2025-26 from Rs 633.59 crore in FY 2024-25, while EBITDA, or earnings before interest, tax, depreciation and amortisation, increased to Rs 77.90 crore from Rs 72.90 crore. Kopran’s stated EBITDA margin was 11.43% in FY 2025-26, below 18.3% in FY 2021-22. The presentation specifies that EBITDA excludes other income and foreign-exchange losses.
At HY Sep-2026, sales and other income were Rs 368.56 crore, EBITDA was Rs 18.22 crore and net profit was Rs 11.10 crore. The half-year EBITDA margin was 9.34%, compared with 11.43% for FY 2025-26. Depreciation was Rs 11.66 crore in HY Sep-2026, while finance costs were Rs 7.54 crore, two expense lines reported alongside the lower half-year profit.
Conclusion
Kopran’s reported record combines a substantially larger fixed-asset base and higher borrowings with returns below earlier levels. Net fixed assets rose from Rs 141.39 crore in FY 2019-20 to Rs 371.24 crore in FY 2025-26, while annual net profit declined from Rs 61.61 crore in FY 2020-21 to Rs 25.73 crore in FY 2025-26 and RoE fell from 28.3% to 4.9%.
The disclosed HY Sep-2026 position shows borrowings of Rs 208.37 crore, net debt-to-equity of 0.38x and an EBITDA margin of 9.34%. The presentation does not disclose a borrowing-repayment schedule, capital-expenditure target or return-ratio target, leaving future disclosures on debt, margins, profit and returns as the key unresolved measures to watch.