










Nuvama Q2 operating PAT rises 26% as revenue outpaces costs
Key highlights
- Nuvama’s Q2 FY27 Operating PAT rose 26% year on year to US$35 million.
- Nuvama’s Q2 FY27 revenue rose 21% to US$103 million while total costs increased 16% to US$56 million.
- Nuvama’s Q2 FY27 cost-to-income ratio declined to 54% from 57% in Q2 FY26.
- Nuvama Asset Services Q2 FY27 revenue grew 53% year on year to US$27 million.
powered by IRIS
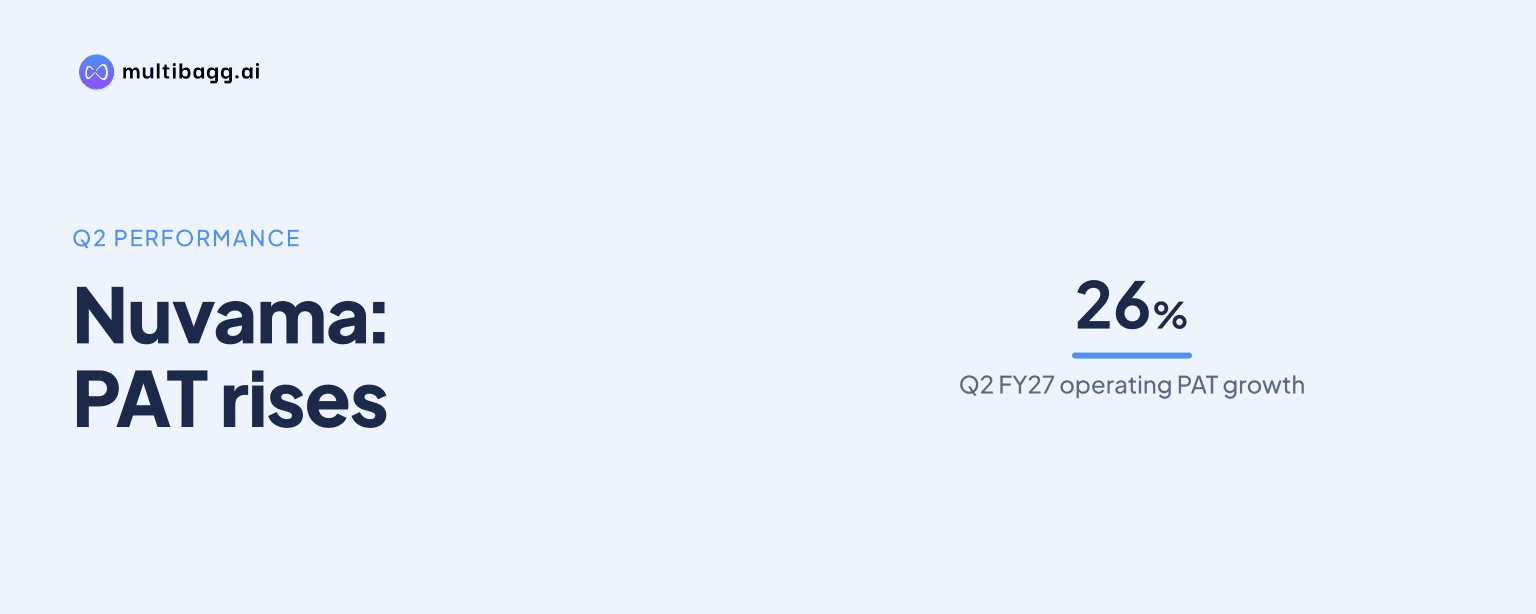
Nuvama Group reported Q2 FY27 operating profit after tax of US$35 million, up 26% year on year, as revenue increased 21% to US$103 million while total costs rose 16% to US$56 million. Nuvama’s cost-to-income ratio improved to 54% from 57% in Q2 FY26, before exceptional items.
Know Nuvama Wealth Management inside out
Results, valuation, peers and who's buying, in one view.
How did Nuvama's Q2 FY27 earnings change?
Nuvama’s Q2 FY27 operating profit after tax, or Operating PAT, increased to US$35 million from US$28 million in Q2 FY26, a 26% rise. Operating profit before tax, or Operating PBT, increased 29% to US$47 million from US$37 million, while reported profit after tax rose 19% to US$33 million from US$28 million.
Revenue growth exceeded cost growth during Q2 FY27. Total revenue rose by US$18 million year on year to US$103 million, compared with an US$8 million increase in total costs to US$56 million. This difference was reflected in the cost-to-income ratio, which declined by 3 percentage points from 57% in Q2 FY26 to 54% in Q2 FY27.
The quarter also improved sequentially in several operating measures. Revenue increased from US$100 million in Q1 FY27 to US$103 million in Q2 FY27, while Operating PBT increased from US$45 million to US$47 million and Operating PAT rose from US$34 million to US$35 million. Reported profit after tax moved the other way, declining from US$34 million in Q1 FY27 to US$33 million because of an exceptional item recorded in Q2.
What drove Nuvama's cost-to-income improvement?
Nuvama’s cost-to-income ratio improved because Q2 FY27 revenue grew 21%, ahead of the 16% increase in total costs. The ratio was calculated before exceptional items and was also lower than the 55% reported in Q1 FY27. Over the first half, the ratio improved to 55% in H1 FY27 from 56% in H1 FY26.
Employee cost was the largest expense category, rising 19% year on year to US$42 million in Q2 FY27 from US$35 million. Other operating expenditure, or opex, increased 9% to US$14 million from US$13 million. Employee cost growth was therefore above total-cost growth, while opex growth was below the 16% increase in total costs.
For H1 FY27, total costs rose 17% to US$111 million from US$94 million in H1 FY26, while revenue increased 20% to US$203 million from US$169 million. Employee cost increased 18% to US$83 million and opex rose 16% to US$28 million. Operating PAT for the half year rose 21% to US$69 million from US$57 million, while Operating PBT increased 23% to US$92 million from US$75 million.
Got a follow-up? Ask IRIS
Which Nuvama businesses contributed most to Q2 revenue?
Nuvama Wealth Management was the largest Q2 FY27 revenue contributor, generating US$55 million, up 14% year on year from US$48 million. The business accounted for 53% of total revenue and increased sequentially from US$49 million in Q1 FY27. Its H1 FY27 revenue was US$104 million, up 16% from US$90 million in H1 FY26.
Asset Services recorded the fastest Q2 FY27 revenue growth among the disclosed businesses. Revenue rose 53% year on year to US$27 million from US$18 million, although it was below US$28 million in Q1 FY27. H1 FY27 Asset Services revenue rose 43% to US$55 million from US$39 million, making it the second-largest revenue contributor after Wealth Management.
Capital Markets generated US$19 million in Q2 FY27, up 9% year on year from US$18 million but below US$20 million in Q1 FY27. Asset Management reported US$2 million of management-fee revenue in Q2 FY27, with management fees down 2% year on year. For H1 FY27, Capital Markets revenue rose 5% to US$39 million, while Asset Management management-fee revenue was US$4 million, up 11% year on year.
What was the impact of Nuvama's Asset Management charge?
Nuvama recorded a US$2 million exceptional item, net of taxes, in Q2 FY27 and H1 FY27. The company identified it as a one-time charge arising from the pre-closure of its Venture Debt Fund in the Asset Management business. This charge reduced Q2 reported profit after tax to US$33 million, below Operating PAT of US$35 million.
The presentation defines Operating PAT as profit after share of profit from associates and non-controlling interests, but before exceptional items. It also states that Q2 FY27 cost-to-income of 54% and return on equity of 28.9% were reported before exceptional items. H1 FY27 return on equity was 29.2%, compared with 28.9% in H1 FY26.
Nuvama’s total client assets stood at US$60,106 million at Q2 FY27, up 25% year on year. Nuvama Wealth client assets were US$14,195 million, up 20%, while Nuvama Private client assets were US$26,588 million, up 15%. Asset Services assets under clearing and custody rose 55% to US$18,004 million, and Asset Management assets under management were US$1,319 million.
Conclusion
Nuvama’s Q2 FY27 results show operating leverage in the reported numbers: revenue rose 21% to US$103 million, faster than the 16% rise in costs to US$56 million, lifting Operating PAT 26% to US$35 million. Wealth Management supplied 53% of revenue, while Asset Services delivered the fastest segmental revenue growth at 53%.
The next areas to watch are Nuvama’s disclosed capital-management plan and the effect of the US$2 million Venture Debt Fund pre-closure charge on reported earnings. Management lists organic-growth investment, balance-sheet flexibility, merger-and-acquisition opportunities and shareholder returns as capital priorities; net worth was US$500 million on September 30, 2026.