










Nuvama Wealth’s record MPIS inflow accompanies 32% asset growth
Key highlights
- Nuvama Wealth recorded its highest-ever quarterly MPIS net new money of US$36.1 crore in Q2 FY27.
- MPIS client assets rose 32% year on year to US$505.4 crore, while total client assets increased 20% to US$1,419.5 crore.
- Q2 FY27 revenue increased 14% to US$3 crore and profit before tax rose 21% to US$1.1 crore.
- Yield on average assets declined to 0.86% in Q2 FY27 from 0.90% in Q2 FY26.
powered by IRIS
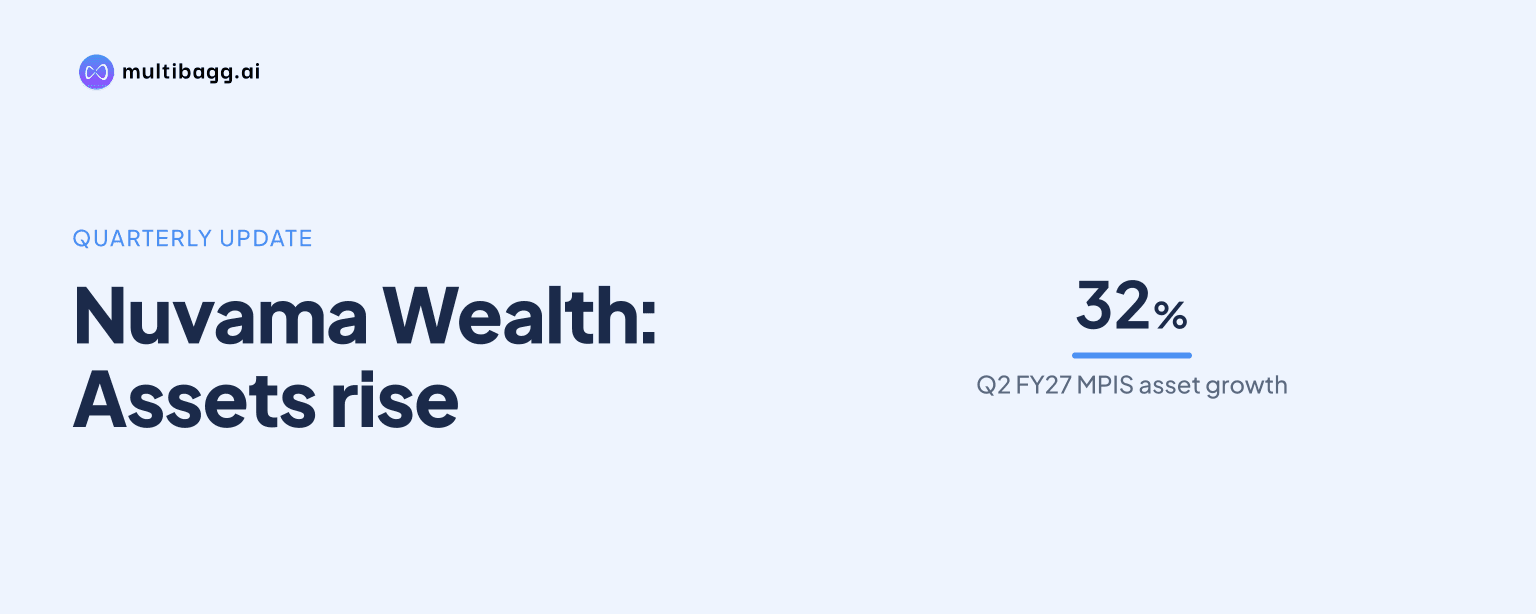
Nuvama Wealth recorded its highest-ever quarterly Managed Products & Investment Solutions (MPIS) net new money of US$36.1 crore in Q2 FY27, equal to 8% of opening MPIS assets, while MPIS client assets rose 32% year on year to US$505.4 crore and total client assets reached US$1,419.5 crore.
Know Nuvama Wealth Management inside out
Results, valuation, peers and who's buying, in one view.
What was Nuvama Wealth’s record MPIS inflow in Q2 FY27?
Nuvama Wealth recorded MPIS net new money of US$36.1 crore in Q2 FY27, its highest-ever quarterly result. The inflow represented 8% of opening MPIS assets, according to the presentation, providing the clearest measure of the quarter’s contribution to managed-product assets.
For H1 FY27, Nuvama Wealth reported MPIS net new money of US$69.6 crore, up 35% from US$51.4 crore in H1 FY26. The first-half inflow was equivalent to 16% of opening MPIS assets, while the Q2 FY27 amount of US$36.1 crore accounted for more than half of H1 FY27 net new money.
Nuvama Wealth attributed the 32% increase in MPIS client assets to traction across managed products and fixed-income solutions. MPIS means Managed Products & Investment Solutions, while net new money measures client inflows after withdrawals; the presentation does not separately quantify the contribution of each product category.
How did Nuvama Wealth’s client assets and yield change?
Nuvama Wealth’s closing client assets increased 20% year on year to US$1,419.5 crore in Q2 FY27 from US$1,184.3 crore in Q2 FY26. MPIS client assets grew faster, rising 32% year on year to US$505.4 crore, showing that this pool expanded more quickly than total client assets over the period.
Yield on average assets declined to 0.86% in Q2 FY27 from 0.90% in Q2 FY26, a fall of 0.04 percentage points. The presentation reports the decline alongside asset growth but does not state a reason for the lower yield.
Nuvama Wealth also said its loan book rose 60% year on year to US$69.9 crore in Q2 FY27, driven by demand for lending solutions. The disclosed figures indicate that MPIS, fixed income and lending all featured in the business’s reported product activity, although the presentation provides no revenue or yield breakdown for those individual products.
How did asset growth affect Nuvama Wealth’s income and profit?
Nuvama Wealth generated Q2 FY27 revenue of US$3 crore, up 14% year on year from US$2.6 crore in Q2 FY26. Profit before tax increased 21% to US$1.1 crore from US$90 lakh, outpacing revenue growth; Nuvama Wealth said operating leverage supported the result.
Nuvama Wealth’s cost-to-income ratio improved to about 63% in Q2 FY27. In H1 FY27, revenue rose 13% to US$5.8 crore from US$5.1 crore in H1 FY26, while profit before tax increased 20% to US$2.1 crore from US$1.8 crore, again showing faster profit growth than revenue growth.
MPIS remained Nuvama Wealth’s largest H1 revenue category, although its share declined to 56% in H1 FY27 from 58% in H1 FY26. Net interest income increased to 24% from 22%, brokerage stayed at 11%, and other revenue increased to 9% from 8%, indicating a modest shift in solution mix rather than a change in distribution channels.
Got a follow-up? Ask IRIS
What is Nuvama Wealth doing to support further growth?
Nuvama Wealth added about 90 relationship managers in H1 FY27 to strengthen its relationship-manager franchise, improve retention and raise productivity. Its reported network included more than 1,150 relationship managers, more than 8,500 active external wealth managers and more than 500 locations, including more than 75 Nuvama Wealth branches.
Nuvama Wealth said it is adding differentiated research, offshore capabilities and new advisory-led offerings to broaden its solutions platform. It reported more than 50 investment solutions across asset classes, covering third-party and in-house products, and said about 20% of its more than 1.3 million clients are serviced by relationship managers and external wealth managers.
The business reported a Net Promoter Score of 89 and a channel revenue split unchanged at 74% from relationship managers and 26% from external wealth managers in both H1 FY26 and H1 FY27. The unchanged channel split means the movement in H1 revenue composition came from MPIS, net interest income and other solutions rather than from a redistribution of revenue between the two channels.
Nuvama Wealth’s longer-term figures provide context for the current asset and flow results. Client assets increased from US$362.8 crore in FY21 to US$1,177 crore in FY26, a stated five-year compound annual growth rate of 27%, while revenue increased from US$3 crore to US$10.6 crore and operating profit before tax rose from US$30 lakh to US$3.6 crore.
Conclusion
Nuvama Wealth combined a record Q2 FY27 MPIS inflow of US$36.1 crore with 32% growth in MPIS client assets and 20% growth in total client assets. Revenue rose 14% to US$3 crore and profit before tax rose 21% to US$1.1 crore, while yield on average assets declined by 0.04 percentage points to 0.86%.
The next reported periods will show whether Nuvama Wealth can sustain the H1 FY27 MPIS net new money of US$69.6 crore and whether roughly 90 relationship-manager additions translate into higher productivity. Management’s disclosed plans to add research, offshore capabilities and advisory-led offerings will also be relevant to the revenue mix and the reported 0.86% yield on average assets.