










Om Galaxy margins eased in H1 FY27 after FY24-FY26 gains
Key highlights
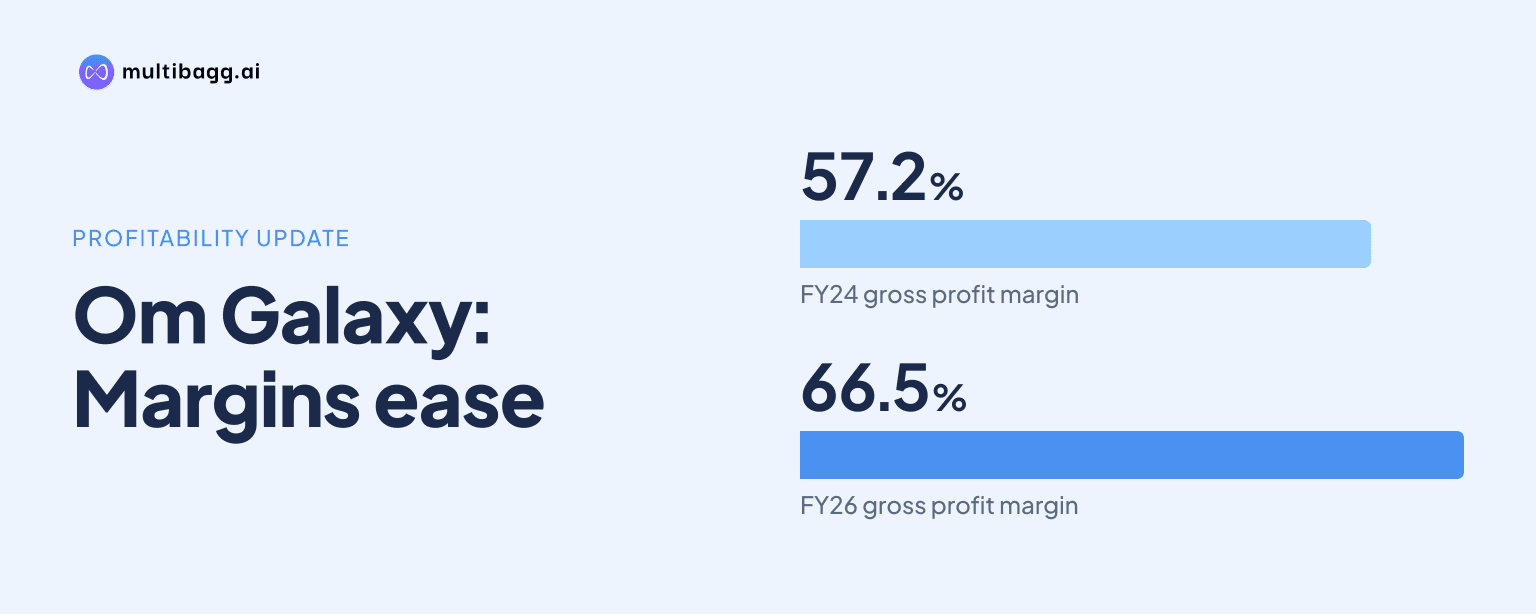
- Om Galaxy's gross profit margin rose to 66.5% in FY26 from 57.2% in FY24, a 930-basis-point increase.
- Om Galaxy reported H1 FY27 revenue of Rs 78.0 crore, up 72%, including Rs 12.0 crore from a one-time order.
- Om Galaxy's H1 FY27 EBITDA margin was 24.8%, down 89 basis points year on year.
- Om Galaxy recorded a Rs 105.34 crore investing cash outflow in H1 FY27 and ended with Rs 99.4 crore of cash.
powered by IRIS
In the first half (H1) of financial year 2027 (FY27), Om Galaxy Limited's earnings before interest, tax, depreciation and amortisation (EBITDA) margin fell 89 basis points to 24.8% and profit after tax (PAT) margin declined 115 basis points to 11.2%, following a 930-basis-point gross-margin expansion from FY24 to FY26.
Know Om Galaxy inside out
Results, valuation, peers and who's buying, in one view.
Why did Om Galaxy's margins improve between FY24 and FY26?
Om Galaxy's reported gross profit margin rose in each of the three financial years, reaching 66.5% in FY26 from 57.2% in FY24. That was a 930-basis-point expansion over two years, with FY25 at 61.8%. EBITDA margin also increased, though less sharply, from 23.0% in FY24 to 25.9% in FY26, a 293-basis-point change.
Profitability grew in rupee terms over the same period. Revenue from operations rose from Rs 104.6 crore in FY24 to Rs 124.0 crore in FY26, representing the presentation's stated 8.9% two-year compound annual growth rate, or CAGR. EBITDA increased from Rs 24.0 crore to Rs 32.1 crore at a 15.6% two-year CAGR, while PAT rose from Rs 12.0 crore to Rs 16.6 crore at a 17.5% two-year CAGR.
Om Galaxy's PAT margin did not follow the same uninterrupted upward trend as gross margin. PAT margin peaked at 14.1% in FY25 before declining 71 basis points to 13.4% in FY26, even as PAT increased Rs 0.7 crore from Rs 15.9 crore. The income statement shows FY26 finance costs rose 57% to Rs 2.1 crore and depreciation rose 31% to Rs 8.4 crore, while EBITDA increased 11%.
Why did Om Galaxy's H1 FY27 EBITDA and PAT margins decline?
Om Galaxy's H1 FY27 EBITDA margin declined to 24.8% from 25.7% in H1 FY26, while PAT margin fell to 11.2% from 12.4%. EBITDA still rose 66% to Rs 19.3 crore and PAT rose 56% to Rs 8.8 crore because revenue grew 72% to Rs 78.0 crore from Rs 45.4 crore.
The presentation identifies Rs 12.0 crore of H1 revenue as coming from a one-time and lumpy order. It says reported H1 revenue growth was 72%, whereas normalized growth was 45%. This disclosure means the reported revenue comparison includes an identified non-recurring order, although the source does not provide a normalized EBITDA or PAT figure.
Costs increased faster than sales in several H1 FY27 lines. Cost of materials consumed rose 136% to Rs 28.3 crore from Rs 12.0 crore, employee costs rose 28% to Rs 17.3 crore, and other expenses rose 60% to Rs 13.2 crore. Finance costs increased 74% to Rs 1.6 crore and depreciation increased 62% to Rs 5.8 crore, compared with EBITDA growth of 66%.
Got a follow-up? Ask IRIS
How did Om Galaxy's working-capital and return metrics change?
Om Galaxy shortened its cash conversion cycle to 152 days in FY26 from 175 days in FY24, despite inventory days increasing to 337 from 213. Debtor days declined to 106 in FY26 from 145 in FY24, including a fall from 135 days in FY25, which more than offset the 124-day increase in inventory days over the two-year comparison.
The returns measures moved differently from operating margins. Return on equity, or ROE, increased from 24.5% in FY24 to 27.9% in FY25, then decreased to 22.8% in FY26. Return on capital employed, or ROCE, similarly rose from 25.7% to 30.4% before falling to 25.5%. The presentation says these ratios use year-end figures for FY24 and average figures for FY25 and FY26.
Om Galaxy's net debt-to-equity ratio was 0.4 in FY26, compared with 0.5 in FY24 and 0.3 in FY25. At the FY26 balance-sheet date, borrowings were Rs 20.2 crore and short-term borrowings were Rs 17.6 crore, while total shareholders' equity was Rs 80.9 crore. These figures provide the reported balance-sheet context for the FY26 ratio rather than a measure calculated from the H1 FY27 statements.
What does Om Galaxy's H1 FY27 cash flow and balance sheet show?
Om Galaxy recorded a Rs 105.34 crore net cash outflow from investing activities in H1 FY27, compared with Rs 44.3 crore in FY26, while financing activities supplied Rs 103.48 crore. Net cash from operating activities was Rs 4.68 crore in H1 FY27, and the combination of operating, investing and financing flows resulted in a Rs 3.16 crore net increase in cash.
Cash and cash equivalents reached Rs 99.4 crore in H1 FY27 from Rs 6.1 crore in FY26. Total shareholders' equity increased to Rs 183.1 crore from Rs 80.9 crore, including reserves and surplus of Rs 166.2 crore versus Rs 69.8 crore. Total assets rose to Rs 301.7 crore from Rs 175.3 crore over the same dates.
The asset base also reflected spending and working-capital changes. Capital work in progress rose to Rs 25.8 crore in H1 FY27 from Rs 15.9 crore in FY26, while inventories increased to Rs 59.7 crore from Rs 43.0 crore. Trade receivables rose to Rs 36.1 crore from Rs 30.0 crore, and total liabilities increased to Rs 115.6 crore from Rs 92.1 crore.
Conclusion
Om Galaxy's FY24-FY26 record shows revenue increasing Rs 19.4 crore, gross profit margin expanding 930 basis points and EBITDA rising Rs 8.1 crore. H1 FY27 then delivered higher reported revenue, EBITDA and PAT, but lower EBITDA and PAT margins as material costs, finance costs and depreciation rose faster than the respective profit lines.
What to watch next is the execution of Om Galaxy's disclosed Rs 100 crore-plus capacity-expansion capex, which is partly funded by initial public offering proceeds and would raise installed capacity from 1,146 to 3,160 metric tonnes per annum. Management also disclosed a Rs 25 crore strategic investment in the WONDRA business-to-consumer cleaning-products platform, alongside the H1 FY27 investment outflow of Rs 105.34 crore.