










PAN HR FY26 EBITDA rose despite a 17% revenue decline year-on-year
Key highlights
- PAN HR's FY26 revenue from operations fell 17.2% to Rs 234.51 crore from Rs 283.19 crore.
- PAN HR's FY26 EBITDA increased 17.1% to Rs 8.56 crore from Rs 7.31 crore.
- PAN HR ended FY26 with cash and bank balances of Rs 24.34 crore, compared with Rs 3.67 crore in FY25.
- PAN HR's FY26 net worth rose to Rs 37.51 crore from Rs 18.15 crore in FY25.
powered by IRIS
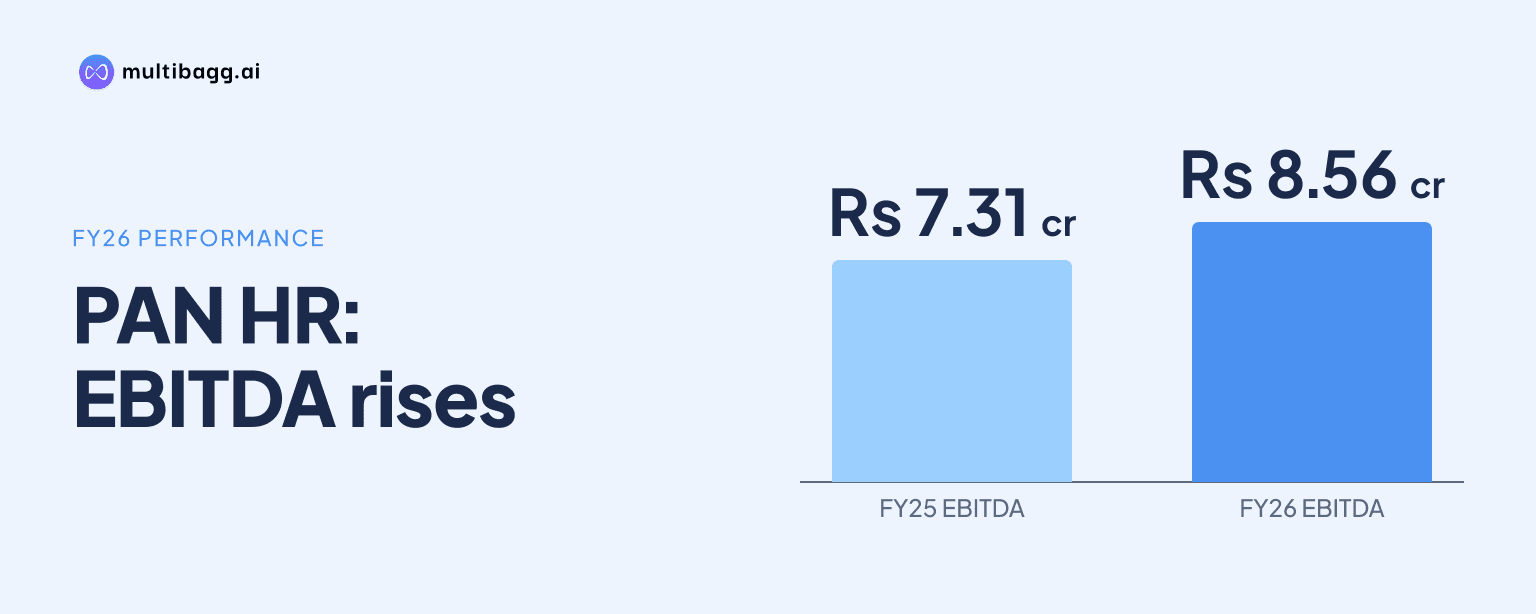
PAN HR Solution Limited reported FY26 revenue from operations of Rs 234.51 crore, down 17% from FY25, while EBITDA rose 17% to Rs 8.56 crore. PAN HR also ended FY26 with cash and bank balances of Rs 24.34 crore, compared with Rs 3.67 crore a year earlier, and reported no long-term or short-term borrowings.
Know PAN HR Solution inside out
Results, valuation, peers and who's buying, in one view.
Why did PAN HR's FY26 revenue decline?
PAN HR's revenue from operations fell by Rs 48.68 crore, or 17.2%, to Rs 234.51 crore in FY26 from Rs 283.19 crore in FY25. The investor presentation provides the annual financial figures but does not state whether the decline arose from a client, sector, contract or other operating factor.
Total income declined by Rs 48.37 crore to Rs 235.26 crore from Rs 283.63 crore. Other income increased to Rs 74.76 lakh in FY26 from Rs 44.18 lakh in FY25, but this increase was insufficient to offset the reduction in revenue from operations.
The lower revenue contrasts with the EBITDA movement, which added Rs 1.25 crore from FY25. EBITDA as a percentage of revenue from operations was about 3.65% in FY26, compared with about 2.58% in FY25, based on the presentation's stated revenue and EBITDA figures.
How did PAN HR increase EBITDA while revenue fell?
PAN HR increased EBITDA because expenses before finance costs and depreciation and amortisation declined by Rs 49.62 crore to Rs 226.70 crore in FY26, exceeding the Rs 48.37 crore fall in total income. EBITDA consequently rose to Rs 8.56 crore from Rs 7.31 crore despite the lower operating revenue base.
Cost of services rendered declined by Rs 47.02 crore to Rs 219.34 crore, while employee benefits expense fell by Rs 2.97 crore to Rs 4.93 crore. Other expenses increased by Rs 36.39 lakh to Rs 2.43 crore from Rs 2.07 crore, so the reduction in service costs and employee benefits accounted for the larger expense movement.
Finance costs fell to Rs 3.21 lakh in FY26 from Rs 6.59 lakh in FY25, and depreciation and amortisation decreased to Rs 32.15 lakh from Rs 38.88 lakh. Profit before tax, or PBT, before exceptional items increased by Rs 1.35 crore to Rs 8.20 crore, compared with Rs 6.85 crore in FY25.
Why did PAN HR's FY26 profit after tax decline?
PAN HR's profit after tax, or PAT, declined to Rs 7.50 crore in FY26 from Rs 9.80 crore in FY25 because FY25 included Rs 6.54 crore of exceptional items. FY26 recorded no exceptional items, leaving reported PBT at Rs 8.20 crore, below FY25's reported PBT of Rs 13.39 crore.
Tax expense declined to Rs 70.18 lakh in FY26 from Rs 3.59 crore in FY25. The presentation does not explain either year's tax charge or describe the nature of the FY25 exceptional items, which limits conclusions on the comparability of the two reported PAT figures.
FY25's reported PBT was Rs 6.54 crore above its PBT before exceptional items of Rs 6.85 crore, whereas FY26 reported the same Rs 8.20 crore figure before and after exceptional items. The pre-exceptional PBT comparison therefore increased year-on-year, while reported PAT was affected by an FY25 item not recorded in FY26.
Got a follow-up? Ask IRIS
What changed in PAN HR's FY26 balance sheet?
PAN HR's net worth increased by Rs 19.36 crore to Rs 37.51 crore in FY26 from Rs 18.15 crore in FY25. Equity increased to Rs 7.21 crore from Rs 2.16 lakh, while reserves rose to Rs 30.30 crore from Rs 18.13 crore.
Cash and bank balances increased by Rs 20.67 crore to Rs 24.34 crore, the largest individual current-asset balance reported in FY26. Total current assets rose to Rs 58.20 crore from Rs 30.17 crore, while total assets increased to Rs 59.64 crore from Rs 35.95 crore.
The FY26 balance sheet lists no long-term borrowings and no short-term borrowings, matching the FY25 presentation. Current liabilities nevertheless rose by Rs 4.23 crore to Rs 21.97 crore, including trade payables of Rs 15.06 crore and other current liabilities of Rs 6.89 crore.
What does PAN HR's FY26 capital position show?
PAN HR's FY26 capital position shows increased equity, reserves and cash, with net worth of Rs 37.51 crore and cash and bank balances of Rs 24.34 crore. The presentation states that PAN HR completed its initial public offering and listing on the BSE SME Platform in February 2026, but it does not attribute the balance-sheet movements to the listing or disclose issue proceeds in these pages.
As of 13 November 2026, the presentation showed a PAN HR share price of Rs 47.00, market capitalisation of Rs 33.89 crore and a 52-week range of Rs 42.00 to Rs 85.50. It listed 72,11,058 shares and a face value of Rs 10.00, while the shareholding pattern as of 30 September 2026 showed promoters and the promoter group holding 63.23% and public shareholders holding 36.77%.
Other non-current assets declined to Rs 40.60 lakh in FY26 from Rs 4.77 crore in FY25, while trade receivables increased to Rs 8.32 crore from Rs 8.06 crore. The Rs 23.69 crore increase in total assets was concentrated in current assets, including cash and other current assets of Rs 21.14 crore.
Conclusion
PAN HR's FY26 results show that operating profit increased even as revenue declined: revenue from operations fell 17.2% to Rs 234.51 crore, while EBITDA rose 17.1% to Rs 8.56 crore as service costs and employee benefits expense fell by more than total income. Reported PAT declined to Rs 7.50 crore because FY25 included Rs 6.54 crore of exceptional items, while FY26 ended with Rs 24.34 crore of cash and Rs 37.51 crore of net worth.
The next reported results will show whether PAN HR can restore revenue growth while maintaining its FY26 cost structure, as the presentation does not explain the revenue decline or provide a revenue target. Investors can also watch for updated shareholding disclosures after the 30 September 2026 pattern and stock data following the 13 November 2026 market snapshot.