










PNGS Reva Diamond Jewellery Limited reports 151% H1 FY27 PAT growth
Key highlights
- PNGS Reva reported H1 FY27 PAT of Rs 51 crore, up 151% year-on-year.
- H1 FY27 EBITDA rose 103% year-on-year to Rs 63 crore.
- Revenue excluding gold sales grew 46% year-on-year in Q2 FY27 and 76% in H1 FY27.
- Management said new EBOs can take 15 to 18 months to contribute to earnings.
powered by IRIS
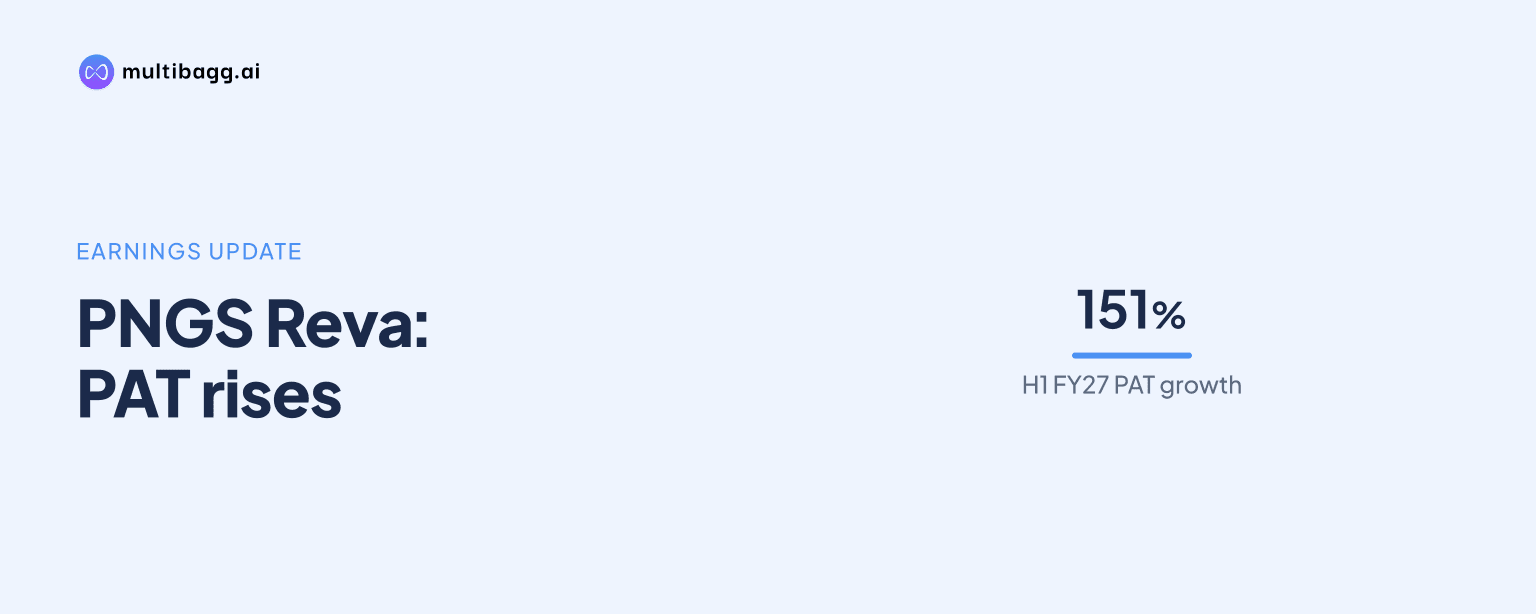
PNGS Reva Diamond Jewellery Limited reported H1 FY27 profit after tax growth of 151% to Rs 51 crore, as revenue excluding gold sales increased 76% year-on-year. The result highlights strong demand momentum for its jewellery business, while management cautioned that new exclusive-brand outlets and marketing spending could weigh on margins in the near term.
Know PNGS Reva Diamond Jewellery inside out
Results, valuation, peers and who's buying, in one view.
What did PNGS Reva report for H1 FY27?
PNGS Reva reported a sharp improvement in financial performance for the first half of FY27. Revenue excluding gold sales rose 76% year-on-year in H1 FY27, while EBITDA increased 103% to Rs 63 crore. Profit after tax, or PAT, rose 151% year-on-year to Rs 51 crore.
The company also reported 46% year-on-year revenue growth for the second quarter of FY27, excluding gold sales. The figures were highlighted around the company’s earnings call scheduled for October 30, 2026. The supplied earnings summary linked the first-half performance to a shift towards natural-diamond jewellery.
Why is the natural-diamond mix relevant to the results?
The natural-diamond shift is relevant because it was identified in the earnings summary as a factor supporting PNGS Reva’s H1 FY27 performance. The company operates in the jewellery retail segment, where product mix, consumer preferences and sales channels can materially influence revenue and profitability.
The disclosed figures separate revenue growth from gold sales. This distinction matters because gold sales can affect reported turnover differently from the jewellery business that management is seeking to build. The available information does not provide a detailed category-wise revenue split, diamond volumes, average selling prices or gross-margin data. It therefore supports an assessment of headline growth, but not a precise calculation of the contribution from each product category.
PNGS Reva has a strong presence in western India, particularly Maharashtra, according to its previous investor communication. Management has also described an expansion strategy focused on Tier-1 cities, selective Tier-2 markets and key metro markets across Maharashtra and North India. That context places the reported first-half growth alongside a broader effort to widen the company’s retail reach.
How could store expansion affect PNGS Reva’s margins?
New exclusive-brand outlets, or EBOs, may pressure PNGS Reva’s margins before they begin contributing meaningfully to earnings. Amit Modak, Whole-Time Director and Chief Executive Officer, said that new EBOs carry costs for the first 15 to 18 months before adding to earnings.
Modak also cautioned that higher marketing expenditure, which is recorded above the EBITDA line, could affect margins by roughly 200 basis points, plus or minus. This is a management caution rather than a confirmed margin outcome. The company has not provided, in the supplied material, a specific EBO count for the current expansion plan or a margin target for FY27.
The warning is significant because the company delivered EBITDA growth of 103% in H1 FY27. Fast profit growth can coexist with near-term cost pressure when a retailer is opening stores, building local awareness and supporting new formats. Investors assessing subsequent results will need to track whether the revenue growth from newer locations begins to offset their initial operating and marketing costs.
Got a follow-up? Ask IRIS
What is PNGS Reva’s current retail-channel position?
PNGS Reva currently receives more than 95% of its revenue from shop-in-shop, or SIS, channels, according to the supplied earnings information. This makes the planned EBO rollout an important operational development because it could gradually change the balance between established SIS distribution and company-led exclusive outlets.
In earlier disclosures, management said expansion would continue in Tier-1 cities with selective entry into Tier-2 cities and metro markets across Maharashtra and North India. A prior earnings-call transcript also referred to an expansion plan involving 15 COCO model stores across Maharashtra and other parts of India. The Q2 FY27 material does not state whether those locations were opened, how many stores were operating, or whether the expansion target changed.
For customers, additional outlets can potentially increase physical access to the brand. For the company, the plan involves a trade-off between near-term rollout costs and the stated goal of long-term earnings growth. The available disclosures do not provide same-store sales, store-level profitability or customer transaction metrics, so the immediate operating impact cannot be quantified from the reported information.
What should investors take from the H1 FY27 numbers?
The key investor takeaway is that PNGS Reva combined strong sales growth with faster growth in EBITDA and PAT during H1 FY27. Revenue excluding gold sales rose 76%, EBITDA reached Rs 63 crore and PAT reached Rs 51 crore. These figures indicate that profitability grew faster than the reported revenue measure over the six-month period.
At the same time, management has explicitly flagged two factors that could affect future margins: the gestation period for new EBOs and higher marketing expenditure. No share-price movement, valuation data, guidance revision or detailed quarterly margin figure was included in the supplied material. As a result, the reported results provide evidence of strong first-half financial growth but do not establish how much of it can be sustained through the remaining quarters.
Conclusion
PNGS Reva’s H1 FY27 update shows substantial improvement in earnings, with PAT rising 151% to Rs 51 crore and EBITDA rising 103% to Rs 63 crore. The 76% increase in revenue excluding gold sales provides the backdrop for that profit growth, while the natural-diamond shift was cited as part of the business momentum.
The next disclosures should clarify the pace and economics of the EBO rollout, including whether new stores move beyond their stated 15-to-18-month cost phase. Investors will also watch for the effect of marketing expenditure on margins, particularly after management indicated a potential impact of roughly 200 basis points, plus or minus.