










PRIMECAB nearly tripled revenue as net debt-to-equity fell
Key highlights
- PRIMECAB's FY26 revenue from operations was Rs 234.9 crore, up from Rs 82.5 crore in FY24.
- PRIMECAB's reported net debt-to-equity ratio declined from 4.6x in FY24 to 0.6x in FY26.
- PRIMECAB reported FY26 EBITDA of Rs 23.5 crore and PAT of Rs 12.3 crore.
- PRIMECAB's debtor days rose to 85 in FY26 from 57 in FY24, while inventory days declined to 62 from 75.
powered by IRIS
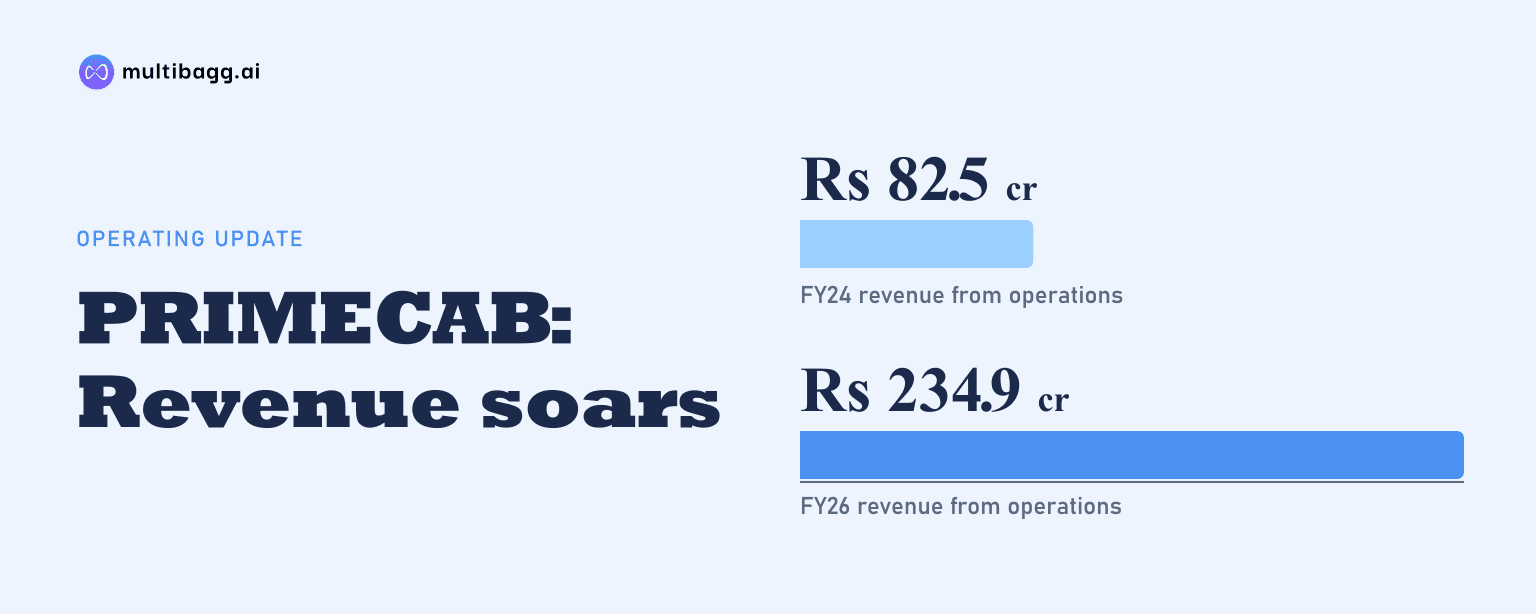
In FY26, PRIMECAB reported revenue from operations of Rs 234.9 crore, up from Rs 82.5 crore in FY24, while its reported net debt-to-equity ratio fell to 0.6x from 4.6x. Profit after tax rose from Rs 1.8 crore to Rs 12.3 crore during the same period.
Know Prime Cable Industries inside out
Results, valuation, peers and who's buying, in one view.
How fast did PRIMECAB's revenue and profit grow?
PRIMECAB's revenue from operations increased by Rs 152.4 crore over FY24 to FY26, rising from Rs 82.5 crore to Rs 141.0 crore in FY25 and Rs 234.9 crore in FY26. The FY26 income statement records year-on-year revenue growth of 67%, following the Rs 58.5 crore increase recorded in FY25. Revenue in FY26 was about 2.8 times the FY24 level.
Earnings also increased across the three reported fiscal years. Earnings before interest, tax, depreciation and amortisation, or EBITDA, rose from Rs 4.9 crore in FY24 to Rs 14.6 crore in FY25 and Rs 23.5 crore in FY26. Profit after tax, or PAT, rose from Rs 1.8 crore to Rs 7.4 crore and then Rs 12.3 crore. For FY26, the income statement reports EBITDA growth of 61% and PAT growth of 67% year on year.
What happened to PRIMECAB's margins during the expansion?
PRIMECAB's EBITDA margin was 10.0% in FY26, compared with 6.0% in FY24 and 10.4% in FY25. This placed the FY26 margin 4.0 percentage points above the FY24 level but 0.4 percentage points below the FY25 reported figure. EBITDA nevertheless increased by Rs 8.9 crore in FY26 as revenue increased by Rs 93.9 crore from FY25.
PRIMECAB's PAT margin rose to 5.2% in FY25 and remained at 5.2% in FY26, versus 2.2% in FY24. The FY26 income statement reports a 2-basis-point change from FY25, reflecting unrounded underlying figures; one basis point equals one-hundredth of a percentage point. Material and service costs, including finished goods and work in progress, increased 69% to Rs 198.1 crore in FY26, against revenue growth of 67%, while employee benefits expense rose 40% to Rs 3.3 crore.
How did PRIMECAB's net debt-to-equity ratio change?
PRIMECAB's reported net debt-to-equity ratio declined to 0.6x in FY26 from 4.6x in FY24, after reaching 2.5x in FY25. The movement coincided with total shareholders' equity increasing from Rs 7.1 crore in FY24 to Rs 14.6 crore in FY25 and Rs 60.8 crore in FY26. Reserves and surplus rose from Rs 6.5 crore to Rs 51.6 crore over the two-year period.
PRIMECAB's lower reported ratio did not result from declines in all borrowings. Non-current borrowings fell from Rs 12.9 crore in FY24 to Rs 10.5 crore in FY26, while current borrowings rose from Rs 19.8 crore to Rs 41.0 crore. Cash and cash equivalents increased from Rs 0.2 crore to Rs 12.9 crore. The presentation reports the net debt-to-equity ratio but does not provide a separate reconciliation of net debt.
Got a follow-up? Ask IRIS
What do PRIMECAB's receivables and cash conversion metrics show?
PRIMECAB's debtor days increased to 85 days in FY26 from 57 days in FY24 and 65 days in FY25. Trade receivables rose from Rs 11.8 crore in FY24 to Rs 38.7 crore in FY25 and Rs 70.5 crore in FY26. The debtor-days measure therefore shows a longer collection period in FY26 even as revenue reached Rs 234.9 crore.
PRIMECAB's inventory days moved lower, declining from 75 days in FY24 to 68 days in FY25 and 62 days in FY26. Inventories nevertheless increased in absolute terms from Rs 16.2 crore in FY24 to Rs 39.4 crore in FY26 as the business expanded. The cash conversion cycle fell from 94 days to 73 days in FY25, then rose to 81 days in FY26, as the increase in debtor days partly offset lower inventory days.
How did PRIMECAB's capacity utilisation and returns move?
PRIMECAB's capacity utilisation rose to 55% in FY26 from 36% in FY25 and 41% in FY24. The FY26 level was 19 percentage points higher than FY25 and coincided with revenue rising by Rs 93.9 crore and EBITDA increasing by Rs 8.9 crore year on year. The presentation does not provide utilisation by product line or plant.
PRIMECAB's return on equity, or ROE, was 32.7% in FY26, compared with 67.8% in FY25 and 28.9% in FY24. Return on capital employed, or ROCE, was 42.8% in FY26, below 53.8% in FY25 but above 26.2% in FY24. Both return measures moderated from FY25 even though FY26 revenue, EBITDA and PAT were the highest figures in the three-year series.
Conclusion
PRIMECAB's FY24-to-FY26 record combines revenue growth from Rs 82.5 crore to Rs 234.9 crore, PAT growth from Rs 1.8 crore to Rs 12.3 crore and a reported net debt-to-equity reduction from 4.6x to 0.6x. EBITDA margin increased from 6.0% to 10.0%, but debtor days rose by 28 days and the cash conversion cycle ended FY26 at 81 days, above FY25's 73 days.
The next disclosed operating milestone is PRIMECAB's medium-voltage cable facility, with its first 5,000-kilometre phase planned for commissioning after Diwali and annual capacity of more than 8,000 kilometres targeted by April 2027. Management's illustrative utilisation ramp assumes 20% for the new 5,000-kilometre facility in FY27 and 85% in FY28, making working-capital movement and execution of the Rs 39.9 crore project relevant measures to watch.