










PTC India Q2 volume rose, but PAT fell as surcharge declined
Key highlights
- PTC India’s Q2-FY27 trading volume rose to 32,463 MUs from 26,178 MUs in Q2-FY26.
- PTC India’s Q2-FY27 PAT fell to Rs 113.23 crore from Rs 133.82 crore.
- PTC India’s Q2-FY27 surcharge income declined to Rs 25.90 crore from Rs 42.61 crore.
- PTC India’s H1-FY27 trading margin rose to Rs 180.19 crore from Rs 174.01 crore, while PAT fell to Rs 183.90 crore.
powered by IRIS
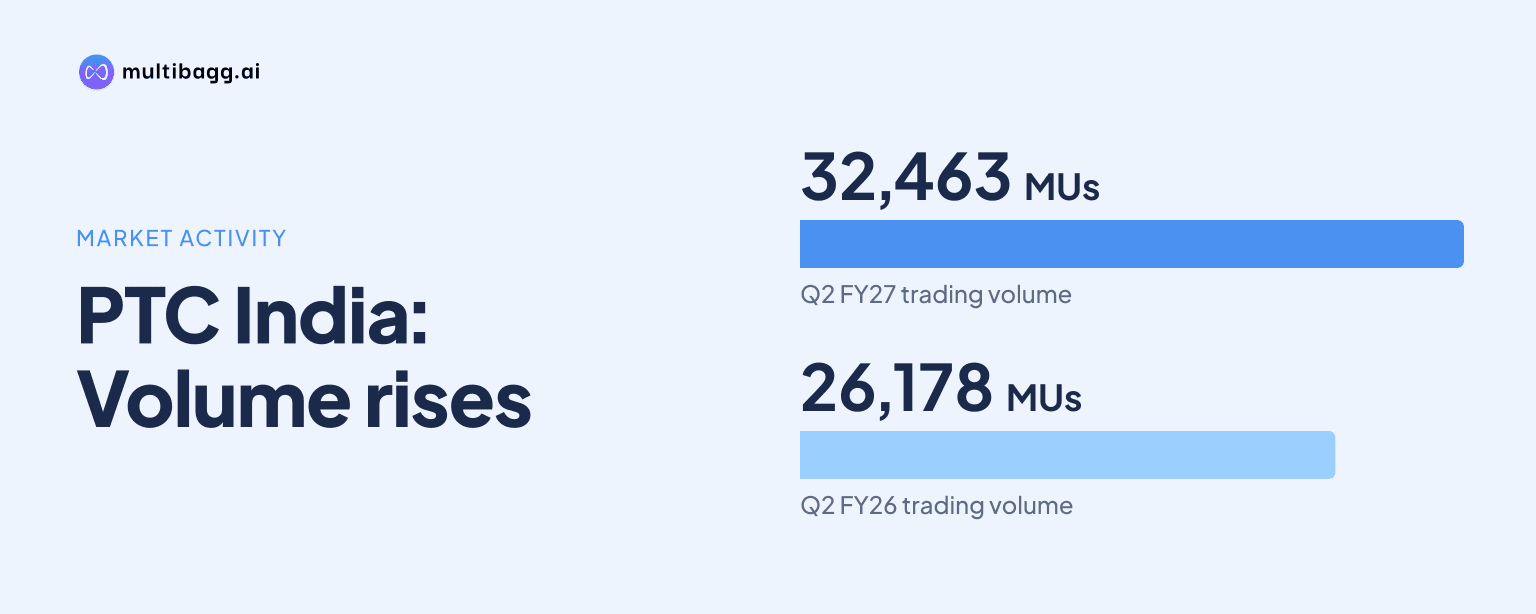
PTC India Limited traded 32,463 million units (MUs) of electricity in Q2-FY27, up from 26,178 MUs a year earlier, but profit after tax (PAT) fell 15.4% to Rs 113.23 crore from Rs 133.82 crore as surcharge income declined to Rs 25.90 crore from Rs 42.61 crore.
Know PTC India inside out
Results, valuation, peers and who's buying, in one view.
Did PTC India trade more electricity in Q2-FY27?
Yes. PTC India traded 32,463 MUs in Q2-FY27, compared with 26,178 MUs in Q2-FY26, an increase of 6,285 MUs. The volume increase was about 24.0% year on year, based on the figures in the standalone investor presentation.
Higher traded volume was not accompanied by increases in every reported operating measure. Operational income declined to Rs 133.90 crore in Q2-FY27 from Rs 136.91 crore in Q2-FY26, consulting income decreased to Rs 9.86 crore from Rs 12.08 crore, and trading margin fell to Rs 93.88 crore from Rs 96.40 crore.
The Q2 comparison separates physical trading activity from reported income and margin. While volume rose by 6,285 MUs, operational income was Rs 3.01 crore lower and trading margin was Rs 2.52 crore lower. The presentation does not provide a per-unit margin calculation, contract mix, or pricing explanation for those movements.
Why did PTC India’s Q2-FY27 profit decline?
PTC India’s Q2-FY27 PAT declined by Rs 20.59 crore, while surcharge income fell by Rs 16.71 crore. PAT was Rs 113.23 crore against Rs 133.82 crore a year earlier, and profit before tax (PBT) decreased to Rs 152.25 crore from Rs 180.34 crore.
Surcharge was the largest disclosed negative movement among the listed Q2 components, declining to Rs 25.90 crore in Q2-FY27 from Rs 42.61 crore in Q2-FY26. Rebate moved in the opposite direction, increasing to Rs 30.16 crore from Rs 28.43 crore, but the presentation does not state that surcharge alone caused the decline in PBT or PAT.
The Rs 28.09 crore decline in Q2 PBT exceeded the Rs 20.59 crore decline in PAT. That difference indicates that the change in tax or other items between PBT and PAT also mattered, but PTC India’s presentation does not provide a tax reconciliation, expense bridge, or other detail to quantify those effects.
Got a follow-up? Ask IRIS
Did PTC India’s H1-FY27 results follow the same pattern?
Yes. PTC India’s H1-FY27 trading volume rose to 58,246 MUs from 49,220 MUs in H1-FY26, while PAT declined to Rs 183.90 crore from Rs 238.60 crore. The 9,026-MU rise in first-half volume coincided with a Rs 54.70 crore reduction in PAT.
Surcharge income fell more sharply in the H1 comparison than in Q2. It declined by Rs 51.30 crore to Rs 28.96 crore in H1-FY27 from Rs 80.26 crore in H1-FY26, while PBT fell by Rs 73.51 crore to Rs 247.79 crore from Rs 321.30 crore. Rebate also decreased to Rs 46.15 crore from Rs 52.11 crore.
The first-half operating picture was mixed rather than uniformly lower. Operational income was Rs 246.96 crore in H1-FY27 versus Rs 248.08 crore in H1-FY26, and consulting income fell to Rs 20.62 crore from Rs 21.96 crore. Trading margin, however, increased by Rs 6.18 crore to Rs 180.19 crore.
Did higher trading volume improve PTC India’s trading margin?
Only in the H1 comparison. PTC India’s trading margin declined by Rs 2.52 crore in Q2-FY27 despite a 6,285-MU volume increase, but rose by Rs 6.18 crore in H1-FY27 alongside a 9,026-MU rise in volume.
In Q2-FY27, PTC India reported trading margin of Rs 93.88 crore, operational income of Rs 133.90 crore and consulting income of Rs 9.86 crore. For H1-FY27, the corresponding figures were Rs 180.19 crore, Rs 246.96 crore and Rs 20.62 crore, respectively.
The differing Q2 and H1 margin results mean that volume growth alone did not determine the reported profitability measures. PTC India’s presentation does not disclose transaction timing, unit economics, contract mix, or the composition of surcharge income that would explain why Q2 trading margin fell while H1 trading margin rose.
Conclusion
PTC India’s reported figures show a divergence between electricity traded and bottom-line earnings in both Q2-FY27 and H1-FY27. Q2 volume rose from 26,178 MUs to 32,463 MUs as PAT declined by Rs 20.59 crore, while H1 volume increased from 49,220 MUs to 58,246 MUs as PAT declined by Rs 54.70 crore. The disclosed surcharge reduction was Rs 16.71 crore in Q2 and Rs 51.30 crore in H1.
The next issue to watch is whether PTC India provides more detail on the drivers of surcharge, tax effects and margin movement in later disclosures. The supplied presentation gives Q2-FY27 and H1-FY27 comparisons but does not disclose a FY27 profit target, surcharge target, operational plan, or a scheduled financial event.