










Radiant derives 82.8% revenue from Tier 2 and Tier 3+ towns
Key highlights
- Radiant received 82.8% of Q2FY27 revenue from Tier 2 and Tier 3+ towns.
- Radiant’s top five clients accounted for 51% of Q2FY27 revenue, and its largest client accounted for 19%.
- Radiant operated 79,374 touch points across 15,165 pin codes, 28 states and 8 Union Territories.
- Radiant reported Q2FY27 consolidated revenue of Rs 109.5 crore and profit after tax of Rs 2.1 crore.
powered by IRIS
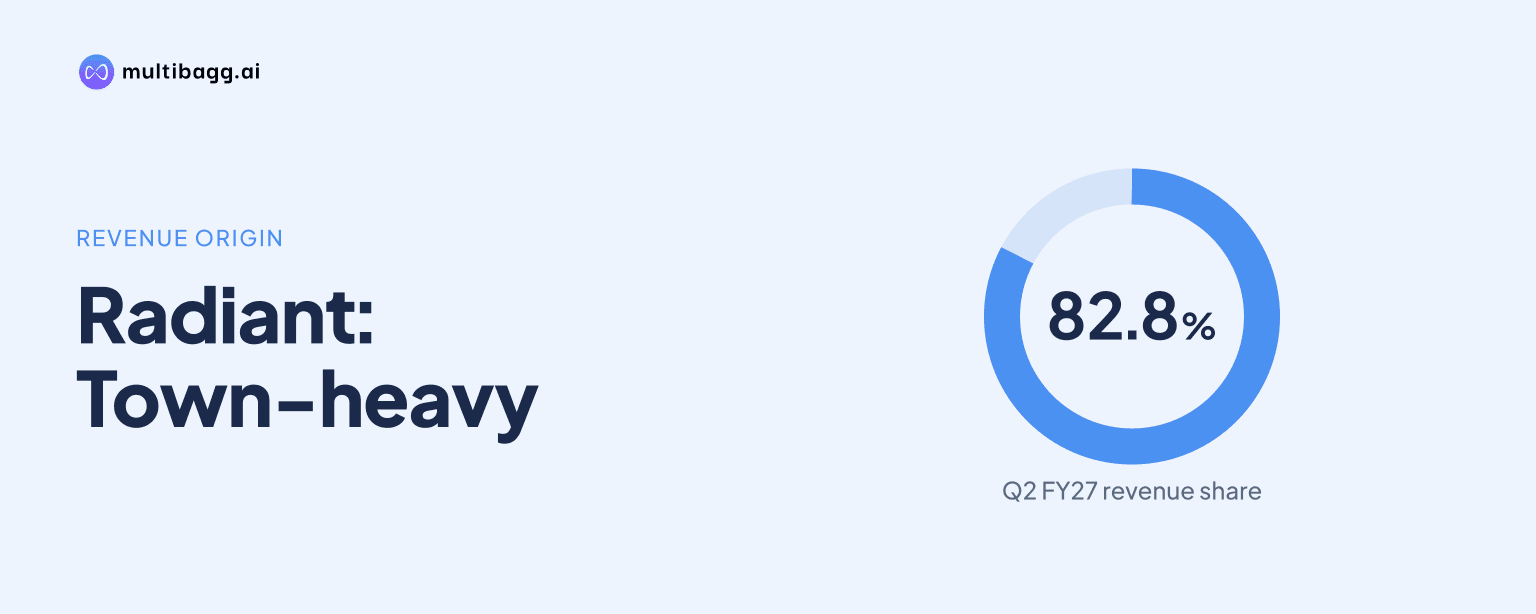
Radiant Cash Management Services reported that Tier 2 and Tier 3+ towns generated 82.8% of revenue in Q2FY27, while its five largest clients accounted for 51% of revenue. The disclosures show a cash-logistics network concentrated in non-metro markets alongside meaningful revenue dependence on a limited group of clients.
Know Radiant Cash Management Services inside out
Results, valuation, peers and who's buying, in one view.
How dependent is Radiant on Tier 2 and Tier 3+ towns?
Radiant derived 82.8% of Q2FY27 revenue from Tier 2 and Tier 3+ towns. These markets also represented 81.4% of its touch points, meaning their share of revenue was 1.4 percentage points higher than their share of locations.
The Tier 2 and Tier 3+ revenue share declined across the three disclosed periods, although it remained above 80%. It was 84.2% in FY25, fell to 83.5% in FY26 and reached 82.8% in Q2FY27, a decrease of 1.4 percentage points from FY25 and 0.7 percentage points from FY26.
Radiant’s network covered 79,374 touch points and 15,165 pin codes across 28 states and eight Union Territories. Regional touch-point data, reported as of 31 March 2026 and excluding Lakshadweep, showed 8,628 touch points in Tamil Nadu, including Chennai and ROTN, and 8,153 in Andhra Pradesh plus Telangana.
How concentrated is Radiant’s client revenue?
Radiant’s top five clients contributed 51% of revenue in Q2FY27. Its largest individual client accounted for 19%, while its top 10 clients supplied 72%, leaving 28% of revenue outside the 10 largest accounts.
Client concentration increased from FY26 across each disclosed grouping. The top client’s contribution rose from 17% in FY26 to 19% in Q2FY27, the top-five share increased from 49% to 51%, and the top-10 share moved from 70% to 72%.
Radiant lists 10 marquee clients, including ICICI Bank, Kotak Mahindra Bank, YES Bank, Standard Chartered, IDBI Bank, Deutsche Bank, Axis Bank, State Bank of India, IndusInd Bank and HDFC Bank. The presentation attributes long-standing relationships to bespoke services, delivery quality, cost-effective services and non-metro reach, but does not disclose revenue by named client.
Got a follow-up? Ask IRIS
What services support Radiant’s non-metro network?
Radiant offers five service categories: Cash Pickup & Delivery, Network Cash Management, Cash Processing, Cash Van Operations and other services. Network Cash Management is specifically designed for locations where a client does not have a bank branch: cash is deposited in Radiant’s bank account and funds are subsequently transferred electronically.
Cash Pickup & Delivery is billed at a fixed amount per point per month, based on outlet location and daily cash limits. Cash Processing fees are linked to the quantum of cash picked up, while Cash Van Operations are charged at a fixed monthly or daily amount per van, with additional charges for excess time and distance.
Radiant identifies growth in Tier 3+ points, where bank-branch presence is limited, as a driver for Network Cash Management. Other offerings include Man Behind Counter services, billed by monthly headcount, and vault operations, billed according to the quantum and value of storage and its duration.
The Cash Van Operations growth drivers include currency in circulation, cash replacement by the Reserve Bank of India (RBI), and bank branch-network expansion. Its Cash Pickup & Delivery growth driver is additional service points, particularly beat-pickup points that are serviced every working day.
What do Radiant’s Q2FY27 financials show alongside this revenue mix?
Radiant reported consolidated revenue of Rs 109.5 crore in Q2FY27, up 3.6% from Rs 105.7 crore in Q1FY27 and 4.6% from Rs 104.7 crore in Q2FY26. The disclosed town and client mix therefore applied during a quarter of growth on both sequential and year-on-year revenue comparisons.
Earnings before interest, tax, depreciation and amortisation (EBITDA) were Rs 7.6 crore in Q2FY27, compared with Rs 11.9 crore in Q1FY27 and Rs 14 crore in Q2FY26. EBITDA margin was 6.8%, down from 11.0% in the preceding quarter and 13.1% a year earlier.
Other expenses were Rs 78.3 crore in Q2FY27, rising 10.3% sequentially from Rs 70.9 crore and 12.9% year on year from Rs 69.3 crore. Employee costs were Rs 25.8 crore, or 23.1% of total income, compared with 23.4% in Q1FY27 and 22.1% in Q2FY26.
Profit after tax was Rs 2.1 crore in Q2FY27, compared with Rs 5.2 crore in Q1FY27 and Rs 7.7 crore in Q2FY26. Net profit margin was 1.8%, versus 4.8% sequentially and 7.2% a year earlier, while revenue from Tier 2 and Tier 3+ towns accounted for 82.8% of the quarter’s revenue.
Conclusion
The reported mix combines broad non-metro operating coverage with concentrated account exposure: 81.4% of touch points were in Tier 2 and Tier 3+ markets, while the top 10 clients supplied 72% of Q2FY27 revenue. The movement in concentration from FY26, including a two-percentage-point rise in the top-10 share, shows that geographical breadth did not eliminate dependence on larger accounts.
The next disclosures to watch are whether the Tier 2 and Tier 3+ revenue contribution continues its decline from 84.2% in FY25 and whether the top-five client share changes from 51%. Radiant’s stated operational initiatives include application programming interface integration with some client enterprise-resource-planning software, CPIN or one-time-password controls for cash collection, QR-code collection records and mobile applications for reconciliation.