










Radiant profit fell overall as short-term borrowings climbed
Key highlights
- Radiant's standalone FY26 profit was Rs 38.2 crore, compared with Rs 62.7 crore in FY23.
- Profit rose to Rs 45.7 crore in FY25 from Rs 45.4 crore in FY24, breaking a consecutive-decline sequence.
- Short-term borrowings increased from Rs 26.9 crore in FY23 to Rs 160 crore in H1FY27.
- Revenue from operations reached Rs 405.1 crore in FY25 before easing to Rs 401.3 crore in FY26.
powered by IRIS
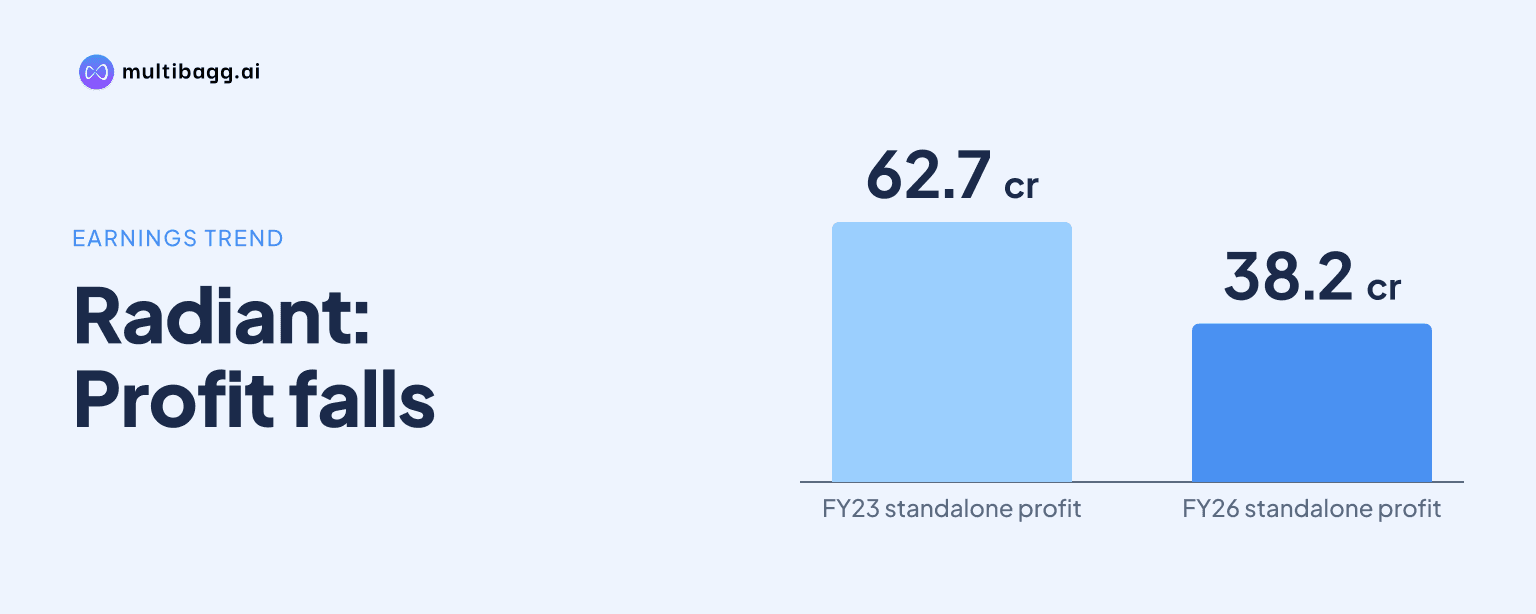
Radiant Cash Management Services reported FY26 standalone profit of Rs 38.2 crore, down from Rs 62.7 crore in FY23, while short-term borrowings rose to Rs 160 crore by H1FY27 from Rs 26.9 crore. Profit was not lower in every intervening full year, because it increased marginally in FY25.
Know Radiant Cash Management Services inside out
Results, valuation, peers and who's buying, in one view.
Did Radiant's standalone profit decline for three consecutive years?
No. Radiant's standalone profit declined from Rs 62.7 crore in FY23 to Rs 45.4 crore in FY24, increased marginally to Rs 45.7 crore in FY25, and then declined to Rs 38.2 crore in FY26. The Rs 0.3 crore FY25 increase interrupts a sequence of three consecutive annual declines, although FY26 profit was Rs 24.5 crore below FY23.
Profit before tax followed a similar, though not identical, path: it was Rs 84.3 crore in FY23, Rs 61.8 crore in FY24, Rs 62.1 crore in FY25 and Rs 47 crore in FY26. Basic and diluted earnings per share, based on a face value of Rs 1 each, fell from Rs 6.11 in FY23 to Rs 3.58 in FY26; they were Rs 4.26 in FY24 and Rs 4.28 in FY25.
The H1FY27 standalone result was Rs 11.9 crore of profit, compared with Rs 15.2 crore of profit before tax. H1FY27 is a partial period and is not directly comparable with the four full-year figures because the presentation does not provide corresponding first-half results for earlier years.
How did Radiant's revenue and expenses change?
Radiant's revenue from operations rose from Rs 354.9 crore in FY23 to Rs 405.1 crore in FY25, then edged down to Rs 401.3 crore in FY26. Total income, including other income, reached Rs 411.5 crore in FY25 and was Rs 410.7 crore in FY26, compared with Rs 357.5 crore in FY23. Revenue from operations in H1FY27 was Rs 212.8 crore and total income was Rs 217.8 crore.
Total expenses increased in each full year shown, from Rs 273.2 crore in FY23 to Rs 328.5 crore in FY24, Rs 349.4 crore in FY25 and Rs 363.7 crore in FY26. The gap between total income and total expenses, reflected in profit before tax, narrowed from Rs 84.3 crore in FY23 to Rs 47 crore in FY26 even though total income was higher in FY26 than in FY23.
Employee benefits expense rose from Rs 60.5 crore in FY23 to Rs 86.3 crore in FY26, while other expenses increased from Rs 207.3 crore to Rs 263.1 crore over the same period. Depreciation and amortisation rose from Rs 4.5 crore to Rs 9.6 crore, and finance costs increased from Rs 0.9 crore to Rs 4.7 crore. In H1FY27, employee benefits expense was Rs 48.2 crore, other expenses were Rs 146.7 crore and finance costs were Rs 2.7 crore.
Got a follow-up? Ask IRIS
Why did Radiant's short-term borrowings rise?
The financial tables show that Radiant's short-term borrowings rose sharply, but they do not state a reason for the increase. Short-term borrowings were Rs 26.9 crore in FY23 and Rs 25.6 crore in FY24, before rising to Rs 88.9 crore in FY25, Rs 150 crore in FY26 and Rs 160 crore in H1FY27. The H1FY27 balance was Rs 133.1 crore above the FY23 level.
The increase changed the composition of current liabilities. Total current liabilities were Rs 48 crore in FY23 and Rs 50.1 crore in FY24, then increased to Rs 118.6 crore in FY25, Rs 180.9 crore in FY26 and Rs 193.8 crore in H1FY27. Short-term borrowings made up Rs 160 crore of the H1FY27 total, while other financial liabilities were Rs 23.5 crore and other current liabilities were Rs 6.2 crore.
Finance costs rose alongside the larger borrowing balance, increasing from Rs 2.1 crore in FY25 to Rs 4.7 crore in FY26 after being Rs 0.9 crore in FY23. The presentation does not identify borrowing facilities, interest rates, maturity dates, security or specific operating uses, so these factors cannot be determined from the supplied tables.
What changed in Radiant's equity and asset mix?
Radiant's total equity increased from Rs 229.9 crore in FY23 to Rs 283.9 crore in FY26, before declining to Rs 269.1 crore in H1FY27. Equity share capital remained Rs 10.7 crore in every reported period, while other equity rose from Rs 219.3 crore in FY23 to Rs 273.2 crore in FY26 and then fell to Rs 258.4 crore in H1FY27.
Total liabilities increased more rapidly than equity between FY23 and FY26, moving from Rs 48.9 crore to Rs 187.5 crore. Total equity and liabilities consequently rose from Rs 278.9 crore in FY23 to Rs 471.4 crore in FY26; the H1FY27 total was Rs 468.5 crore. Non-current liabilities were Rs 6.6 crore in FY26 and Rs 5.6 crore in H1FY27, consisting principally of lease liabilities.
On the asset side, cash and cash equivalents increased from Rs 98 crore in FY23 to Rs 214 crore in FY26, then decreased to Rs 178.4 crore in H1FY27. Trade receivables were Rs 70.2 crore in FY23, Rs 78.4 crore in FY26 and Rs 96.7 crore in H1FY27. Other non-current financial assets increased from Rs 8.4 crore in FY23 to Rs 107 crore in FY26 and Rs 114.9 crore in H1FY27, while bank balances other than cash and cash equivalents fell from Rs 73.8 crore to Rs 5.8 crore across those endpoints.
Conclusion
Radiant's standalone financial history does not support a claim of profit declining for three consecutive full years, because profit rose from Rs 45.4 crore in FY24 to Rs 45.7 crore in FY25. It does show FY26 profit of Rs 38.2 crore, below the Rs 62.7 crore recorded in FY23, alongside revenue that reached Rs 405.1 crore in FY25 before easing to Rs 401.3 crore in FY26 and a substantial increase in short-term borrowings.
The next result to watch is the FY27 outcome following H1FY27 revenue from operations of Rs 212.8 crore, profit of Rs 11.9 crore and short-term borrowings of Rs 160 crore. The presentation does not disclose a borrowing-reduction target, funding plan or explanation for the higher short-term borrowing balance, leaving the full-year direction of these items unresolved.