










Raymond Limited cut short-term debt share to 38% by FY26
Key highlights
- Raymond reduced short-term debt to 38% of gross debt at 31 March 2026 from 74% at 31 March 2020.
- Raymond's liquidity increased to Rs 2,791 crore in FY26 from Rs 571 crore in FY20.
- Long-term debt was Rs 1,975 crore in FY26, exceeding short-term debt of Rs 1,237 crore.
- Raymond reported a 4.24-year average debt maturity and an 8.22% average borrowing cost in FY26.
powered by IRIS
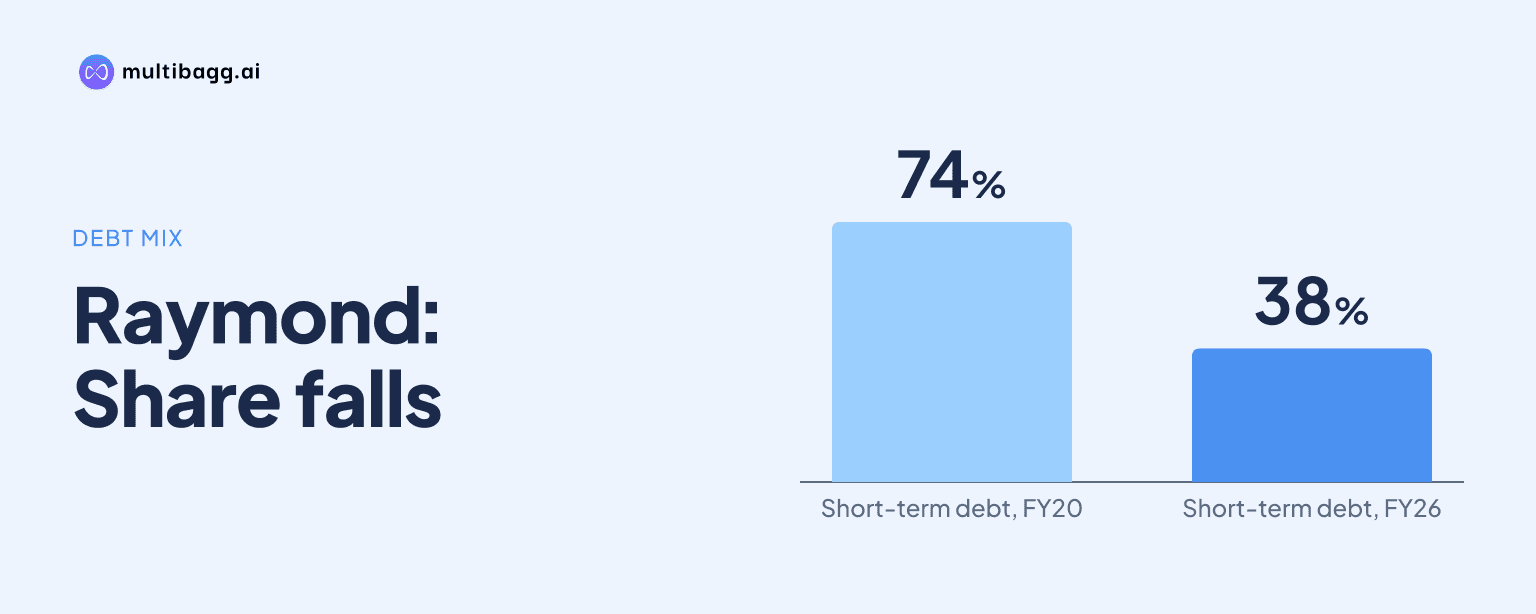
Raymond Limited reduced short-term debt to 38% of gross debt at 31 March 2026 from 74% at 31 March 2020, while liquidity increased to Rs 2,791 crore from Rs 571 crore. Raymond also reported Rs 1,975 crore of long-term debt, a 4.24-year average debt maturity and an 8.22% average borrowing cost at FY26-end.
Know Raymond inside out
Results, valuation, peers and who's buying, in one view.
How did Raymond change its debt mix by FY26?
Raymond shifted the composition of its borrowings toward longer-term funding by 31 March 2026. Short-term debt was Rs 1,237 crore and long-term debt was Rs 1,975 crore, meaning long-term borrowings exceeded short-term borrowings by Rs 738 crore. The presentation describes this as a transition from high-pressure short-term debt to stable long-term financing.
The FY20-to-FY26 comparison shows that long-term debt increased while short-term debt declined. Long-term debt rose from Rs 644 crore on 31 March 2020 to Rs 1,975 crore on 31 March 2026, an increase of Rs 1,331 crore. Over the same period, short-term debt fell from Rs 1,786 crore to Rs 1,237 crore, a reduction of Rs 549 crore.
The FY23-to-FY26 movement was not solely a reduction in short-term borrowings. Short-term debt rose by Rs 485 crore from Rs 752 crore at 31 March 2023, but long-term debt increased by a larger Rs 602 crore from Rs 1,373 crore. The reported short-term share of gross debt was nevertheless 38% in FY26, compared with 74% in FY20.
How much liquidity did Raymond have at 31 March 2026?
Raymond had Rs 2,791 crore of liquidity at 31 March 2026, up Rs 2,220 crore from Rs 571 crore at 31 March 2020. Liquidity also increased by Rs 1,415 crore from Rs 1,376 crore at 31 March 2023. The presentation identifies the increase as a liquidity build-up alongside the longer-term debt mix.
Raymond defines liquidity as more than cash held in operating accounts. The measure includes cash and cash equivalents, bank balances, current investments, market value of marketable securities classified as non-current investments, margin money, and deposits held for more than 12 months. This definition applies to the Rs 2,791 crore FY26 figure used in the portfolio debt table.
The rise in liquidity occurred alongside a lower reported average borrowing cost over the FY20-to-FY26 period. The average borrowing cost was 8.22% at 31 March 2026, compared with 8.60% at 31 March 2020 and 8.50% at 31 March 2023. The presentation does not provide a split of the Rs 2,220 crore liquidity increase between operating cash generation, financing, asset transactions or investment movements.
Got a follow-up? Ask IRIS
What does Raymond's net debt to EBITDA history show?
Raymond reported net debt to earnings before interest, taxes, depreciation and amortisation, or EBITDA, of 0.26 times at 31 March 2026. The ratio was 0.54 times at 31 March 2023 and negative 0.36 times at 31 March 2025. Raymond defines net debt as gross debt less cash balances.
The historical series changed substantially after FY21, when net debt to EBITDA was 10.48 times. It was 3.04 times at 31 March 2020, declined to 1.25 times in FY22 and 0.54 times in FY23, then increased to 1.17 times in FY24 before turning negative in FY25. The FY26 ratio of 0.26 times was 0.28 times below the FY23 reading.
Raymond displays a benchmark range of 2.5 to 3.5 times, a guided range of 3.5 to 4.5 times and a 5.0-times threshold alongside its net debt-to-EBITDA history. The presentation does not specify the source or intended use of those ranges. Its FY26 cost of debt was 8.22%, or 0.28 percentage points below the 8.50% reported in FY23.
What were Raymond's maturity and debt metrics after FY26?
Raymond reported a 4.24-year average debt maturity at 31 March 2026, alongside its 8.22% average borrowing cost. The presentation does not provide a year-by-year repayment schedule or identify the amount of debt maturing in each financial year. Its stated strategic liability shift therefore describes the overall maturity profile rather than a detailed refinancing calendar.
The disclosed cost of debt moved between 7.90% and 8.73% during FY22 to FY26. It was 7.90% at 31 March 2022, rose to 8.50% in FY23 and 8.73% in FY24, then declined to 8.21% in FY25 before reaching 8.22% in FY26. The FY26 rate was 0.51 percentage points below the FY24 high.
A later consolidated snapshot, dated 30 September 2026, reported Rs 3,382 crore of cash balance, Rs 1,647 crore of long-term debt and net debt to EBITDA of 0.43 times. The average maturity of long-term debt was again 4.24 years. These measures are reported at a later date than the 31 March 2026 portfolio debt table and therefore are not directly the same period comparison.
Conclusion
Raymond's disclosures show a balance-sheet change between FY20 and FY26: the short-term debt share fell from 74% to 38%, liquidity rose from Rs 571 crore to Rs 2,791 crore, and long-term debt of Rs 1,975 crore exceeded short-term debt of Rs 1,237 crore. The FY26 average maturity was 4.24 years and the average borrowing cost was 8.22%.
The next disclosed position to watch is the 30 September 2026 consolidated snapshot, which showed Rs 3,382 crore of cash balance, Rs 1,647 crore of long-term debt and net debt to EBITDA of 0.43 times. Raymond has not disclosed a future repayment calendar, borrowing target or specific funding plan in the presentation, leaving subsequent updates to show how the maturity profile and liquidity develop.