










Raymond shifts funding long term as liquidity reaches Rs 2,791 crore
Key highlights
- Raymond reported liquidity of Rs 2,791 crore at 31st March 2026, up from Rs 571 crore at 31st March 2020.
- Short-term debt accounted for 38% of Raymond’s gross debt in 2026, compared with 74% in 2020.
- Raymond reported net debt-to-EBITDA of 0.26 at 31st March 2026 and average debt maturity of 4.24 years.
- Raymond’s consolidated cash balance was Rs 3,382 crore at 30th September 2026.
powered by IRIS
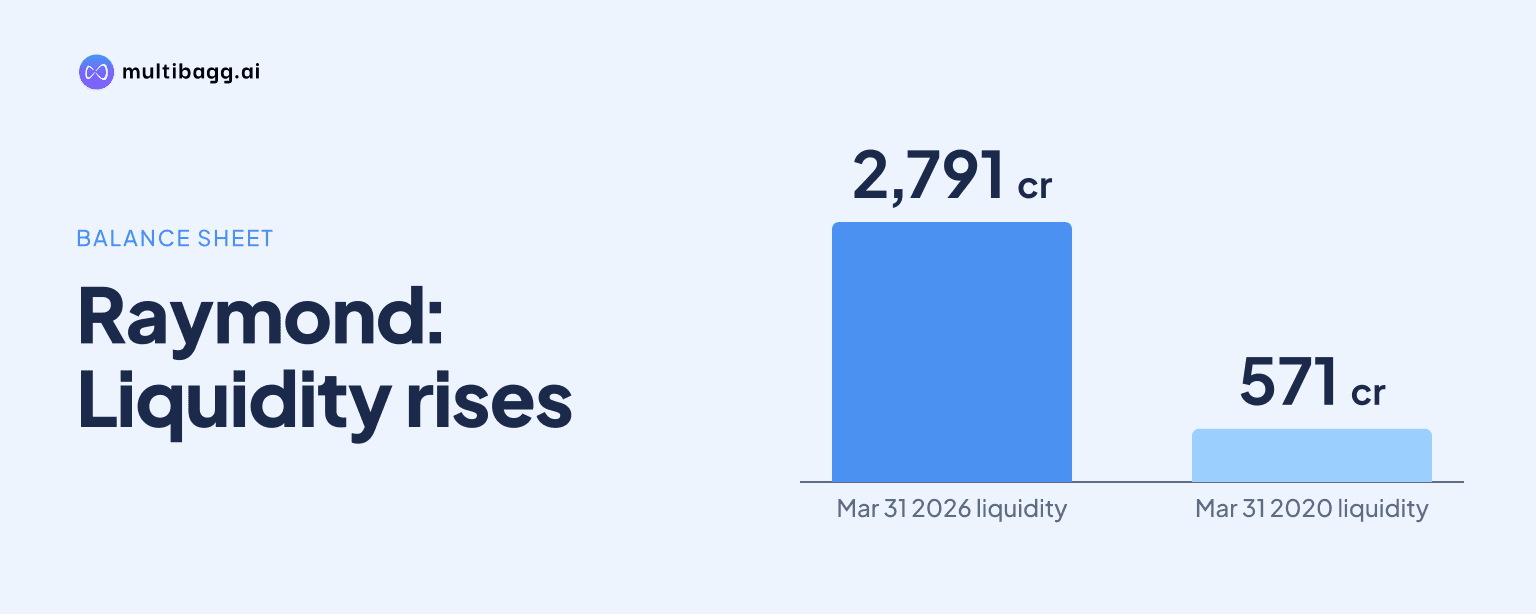
Raymond Portfolio shifted its borrowing mix toward long-term funding by 31st March 2026, when liquidity reached Rs 2,791 crore and short-term debt accounted for 38% of gross debt, versus 74% at 31st March 2020. Raymond reported a 4.24-year average debt maturity and net debt-to-EBITDA of 0.26 at March 2026.
Know Raymond Lifestyle inside out
Results, valuation, peers and who's buying, in one view.
How did Raymond’s debt mix change by March 2026?
Raymond moved the larger portion of its reported borrowings from short-term to long-term funding between 31st March 2020 and 31st March 2026. Short-term debt declined by Rs 549 crore to Rs 1,237 crore, while long-term debt increased by Rs 1,331 crore to Rs 1,975 crore. The presentation says short-term debt’s share of gross debt therefore fell by 36 percentage points, to 38% from 74%.
The change did not occur through a consistent reduction in short-term debt in every period. Short-term debt fell to Rs 752 crore at 31st March 2023 before rising to Rs 1,237 crore in 2026, whereas long-term debt rose from Rs 1,373 crore in 2023 to Rs 1,975 crore in 2026. Based on the two reported debt categories, total borrowings were Rs 3,212 crore in 2026, compared with Rs 2,430 crore in 2020.
Raymond describes the reported move as a transition from high-pressure short-term debt to stable long-term financing. Its average debt maturity was 4.24 years at 31st March 2026. The presentation also describes funding-source concentration and refinance-risk exposure as well distributed, but does not provide lender-level or year-by-year maturity data.
How much liquidity did Raymond build by March 2026?
Raymond built reported liquidity to Rs 2,791 crore at 31st March 2026, an increase of Rs 2,220 crore from Rs 571 crore at 31st March 2020. Liquidity had reached Rs 1,376 crore by 31st March 2023, leaving a further Rs 1,415 crore increase over the subsequent three years. This increase occurred alongside the higher long-term debt balance of Rs 1,975 crore in 2026.
Raymond’s liquidity definition includes more than cash held in operating bank accounts. It comprises cash and cash equivalents, bank balances, current investments, the market value of marketable securities classified as non-current investments, margin money, and deposits held for more than 12 months. The Rs 2,791 crore figure should therefore be read using this broader definition.
The group’s executive summary, dated 30th September 2026, separately reported cash reserves equal to 82% of borrowings and consolidated annual earnings before interest, tax, depreciation and amortisation, or EBITDA, of Rs 1,738 crore. That later disclosure uses a different reporting date from the 31st March 2026 liquidity comparison and should not be treated as the same period-end balance.
Got a follow-up? Ask IRIS
What happened to Raymond’s leverage and borrowing cost?
Raymond’s net debt-to-EBITDA ratio was 0.26 at 31st March 2026, compared with 3.04 at 31st March 2020 and 0.54 at 31st March 2023. The presentation defines net debt as gross debt less cash balances. Its 2026 ratio followed a negative 0.36 in 2025, meaning cash balances exceeded gross debt under the stated definition at that date.
The reported leverage measure varied substantially over the seven year-ends shown. Net debt-to-EBITDA reached 10.48 at 31st March 2021, then declined to 1.25 in 2022 and 0.54 in 2023, before rising to 1.17 in 2024. Raymond lists a benchmark of 2.5 times to 3.5 times, guided leverage of 3.5 times to 4.5 times, and a 5.0-times threshold in its debt-profile presentation.
Raymond’s average borrowing cost was 8.22% at 31st March 2026, compared with 8.60% at 31st March 2020. The reported cost reached 7.90% in 2022, the lowest point in the series, and 8.73% in 2024, the highest. At 8.22%, the 2026 cost was nearly unchanged from 8.21% in 2025.
How did Raymond’s listed entities compare in September 2026?
Raymond Realty Limited had the highest net debt-to-EBITDA ratio among the three listed entities, at 1.70 as of 30th September 2026. Raymond Lifestyle Limited reported negative 0.05 and Raymond Limited reported negative 0.34, while the consolidated ratio was 0.43. These figures are based on the presentation’s trailing-12-month information.
Consolidated cash balance was Rs 3,382 crore at 30th September 2026, against long-term debt of Rs 1,647 crore and negative net long-term debt of Rs 1,736 crore. Raymond Lifestyle held Rs 1,924 crore of cash against Rs 436 crore of long-term debt, and Raymond Limited held Rs 1,151 crore against Rs 443 crore. Raymond Realty reported Rs 308 crore of cash and Rs 768 crore of long-term debt, producing net long-term debt of Rs 460 crore.
Consolidated funds from operations, or FFO, were Rs 1,027 crore on a trailing-12-month basis, with FFO defined as EBITDA less cash tax paid. Raymond Lifestyle contributed Rs 461 crore, Raymond Realty Rs 319 crore and Raymond Limited Rs 247 crore. Average long-term-debt maturity was 4.65 years for Raymond Lifestyle, 3.90 years for Raymond Realty and 4.57 years for Raymond Limited, compared with 4.24 years on a consolidated basis.
Conclusion
Raymond’s March 2026 disclosures show that its borrowing profile had changed in composition as well as scale: long-term debt exceeded short-term debt by Rs 738 crore, liquidity reached Rs 2,791 crore and net debt-to-EBITDA stood at 0.26. Relative to March 2020, the short-term portion of gross debt declined by 36 percentage points while reported liquidity increased by Rs 2,220 crore.
The next disclosed balance-sheet reference is 30th September 2026, when consolidated cash balance was Rs 3,382 crore and Raymond Realty’s net debt-to-EBITDA was 1.70. Future updates can be assessed against the stated 4.24-year consolidated average maturity, the 8.22% March 2026 borrowing cost and management’s displayed leverage ranges of 3.5 times to 4.5 times.