










RR Financial H1 PAT Rises 12.9% as Margin Expands to 30.8%
Key highlights
- RR Financial's H1 FY27 consolidated PAT rose 12.9% to Rs 5.6405 crore.
- H1 FY27 PAT margin increased to 30.8% from 26.1% in H1 FY26.
- H1 FY27 total income fell 4.4% to Rs 18.3263 crore while total expenses declined 11.6% to Rs 10.9795 crore.
- Q2 FY27 PAT was Rs 2.5574 crore, down 17.1% from Q1 FY27 despite 8.6% year-on-year growth in total income.
powered by IRIS
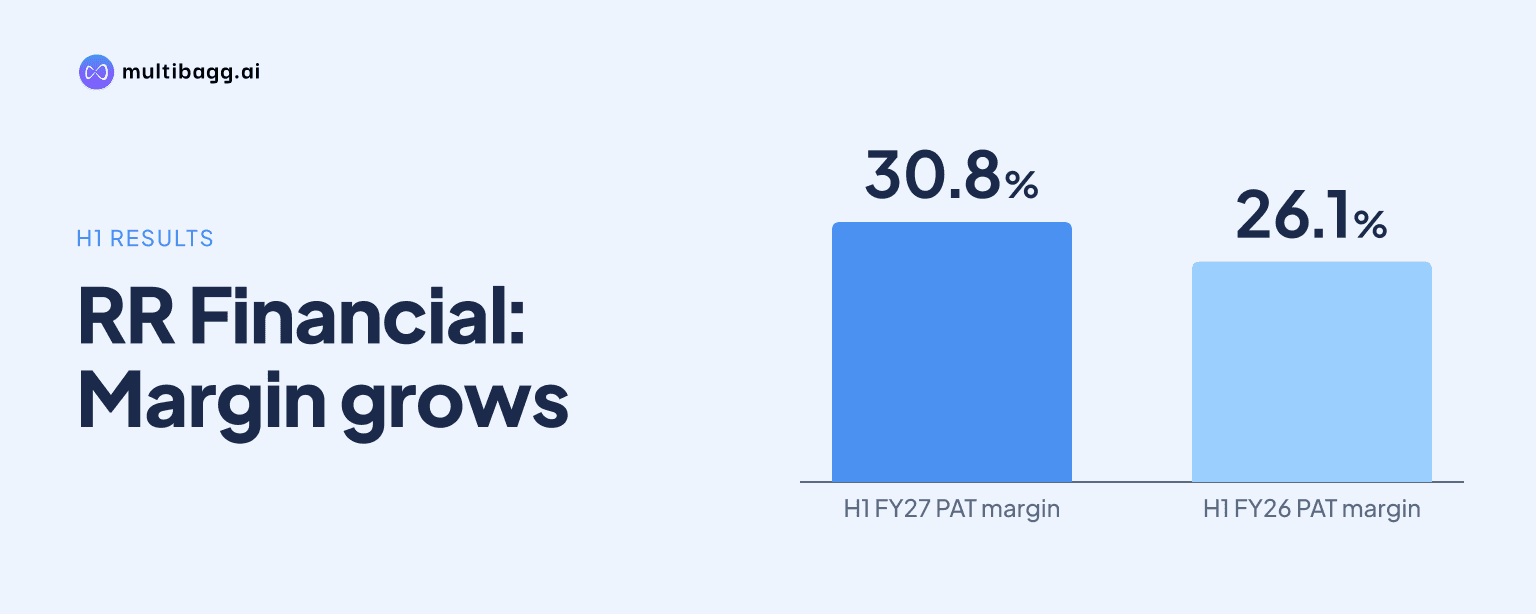
RR Financial Consultants Ltd increased unaudited consolidated H1 FY27 profit after tax by 12.9% to Rs 5.6405 crore despite a 4.4% decline in total income to Rs 18.3263 crore, as total expenses fell 11.6% and PAT margin rose 4.7 percentage points to 30.8% from 26.1%.
Know R R Financial Consultants inside out
Results, valuation, peers and who's buying, in one view.
How did RR Financial raise H1 FY27 profit as income fell?
RR Financial raised H1 FY27 profit because its 11.6% reduction in total expenses exceeded its 4.4% decline in total income. Total expenses fell to Rs 10.9795 crore from Rs 12.4236 crore, while profit before tax increased 9.0% to Rs 7.3468 crore and profit after tax (PAT), defined as net profit after minority interest, reached Rs 5.6405 crore.
The largest expense reduction came from other expenditure, which declined 17.3% to Rs 8.1113 crore from Rs 9.8051 crore. Finance cost fell 29.6% to Rs 20.18 lakh and depreciation and amortisation declined 21.3% to Rs 7.10 lakh. These reductions exceeded a 15.8% increase in employee cost to Rs 2.5954 crore and a 15.8% rise in tax expense to Rs 1.18 crore.
Why did RR Financial's H1 PAT margin increase to 30.8%?
RR Financial's H1 FY27 PAT margin increased to 30.8% from 26.1% in H1 FY26 because PAT rose while total income contracted. The 4.7-percentage-point increase also placed the half-year margin above the 21.2% recorded in audited FY26, when PAT was Rs 7.1502 crore on total income of Rs 33.7828 crore.
Revenue from operations declined 6.6% year on year to Rs 17.8739 crore in H1 FY27 from Rs 19.1291 crore. Other income, however, increased to Rs 45.24 lakh from Rs 3.33 lakh. RR Financial describes the percentage change in other income as not meaningful because of the very small prior-period base, but the absolute increase partly offset the reduction in operating revenue.
Basic earnings per share (EPS), which is not annualised, rose 13.1% to Rs 5.10 in H1 FY27 from Rs 4.51 in H1 FY26. This comparison uses unaudited consolidated results, whereas the FY26 EPS of Rs 6.46 in the annual trend table relates to the audited full year.
Did RR Financial's second-quarter performance match the first-half trend?
RR Financial's Q2 FY27 PAT rose 2.7% year on year but declined 17.1% sequentially as quarterly expenses increased faster than income. Q2 PAT was Rs 2.5574 crore, compared with Rs 2.4904 crore in Q2 FY26 and Rs 3.0831 crore in Q1 FY27, while profit before tax fell 12.6% quarter on quarter to Rs 3.4263 crore.
Revenue from operations increased 2.0% quarter on quarter to Rs 9.0263 crore in Q2 FY27 and was 5.9% above the Q2 FY26 level. Total income was Rs 9.2784 crore, up 2.5% from Q1 FY27 and 8.6% year on year, supported by other income of Rs 25.21 lakh compared with Rs 2.34 lakh in Q2 FY26.
Costs increased faster than income in Q2 FY27. Total expenses rose 14.1% sequentially to Rs 5.8521 crore and were 11.2% above Q2 FY26. Employee cost increased 23.0% year on year to Rs 1.3243 crore, and other expenditure rose 9.8% to Rs 4.3951 crore, while finance cost declined 27.6% to Rs 9.71 lakh. The presentation identifies the employee-cost and other-expenditure increases as investment in the build.
Got a follow-up? Ask IRIS
What do RR Financial's balance sheet and standalone results show?
RR Financial reported total equity of Rs 65.6726 crore at 30 September 2026, up from Rs 59.5046 crore at 31 March 2026, while total assets increased to Rs 84.30 crore from Rs 76.6019 crore. Borrowings rose to Rs 14.183 crore from Rs 13.967 crore, and the company disclosed a debt-to-equity ratio of 0.22 times at the September reporting date.
Cash and bank balances declined to Rs 1.4366 crore at 30 September 2026 from Rs 2.432 crore at 31 March 2026, while investments increased to Rs 6.4304 crore from Rs 4.7478 crore. Property, plant and equipment was broadly unchanged at Rs 22.5523 crore compared with Rs 22.5751 crore. RR Financial states that investments include current and non-current holdings, while borrowings include long-term and current debt.
The standalone entity reported a different H1 FY27 trend from the consolidated group, with total revenue increasing 212.4% to Rs 1.547 crore. Standalone PAT was Rs 95.81 lakh, compared with Rs 15.32 lakh in H1 FY26. RR Financial identifies consolidated results as the primary reference for assessing group-level revenue, costs and margins.
What is RR Financial planning after H1 FY27?
RR Financial says its current and ongoing investment plans are expected to support consistent business growth, subject to the risks identified in its safe-harbor statement. Management's plan includes upgrading in-house talent, alongside the 23.0% year-on-year increase in Q2 FY27 employee cost to Rs 1.3243 crore.
RR Financial identifies RRGlobal and its web platform as an owned, scalable technology base, while a larger online presence is intended to attract and serve clients. The company also cites a senior leadership team as part of its execution structure, but the presentation does not provide a numerical target for future revenue, profit, client acquisition or investment spending.
Conclusion
RR Financial's H1 FY27 result combined lower consolidated income with higher profit because expenses declined more quickly than income. PAT reached Rs 5.6405 crore, PAT margin rose to 30.8%, and basic EPS increased to Rs 5.10, even as revenue from operations declined 6.6% to Rs 17.8739 crore.
The next issue is whether management's investment in talent, RRGlobal, the web platform and a larger online presence delivers the growth it expects. Q2 FY27 showed total expenses rising 14.1% sequentially and PAT falling 17.1% from Q1 FY27, while RR Financial has not disclosed a quantified target or timetable for benefits from those ongoing plans.