










RSWM FY26 profit recovers, but returns remain below FY22
Key highlights
- RSWM reported FY26 PAT of Rs 52 crore after a Rs 41 crore loss in FY25.
- FY26 EBITDA rose to Rs 327 crore from Rs 233 crore in FY25, while EBITDA margin increased to 7.1% from 4.8%.
- Net operational cash flow reached Rs 428 crore in FY26, compared with Rs 410 crore in FY25 and negative Rs 72 crore in FY24.
- FY26 ROCE recovered to 5.1%, but remained below FY22’s 13.8%, while total debt stood at Rs 1,510 crore.
powered by IRIS
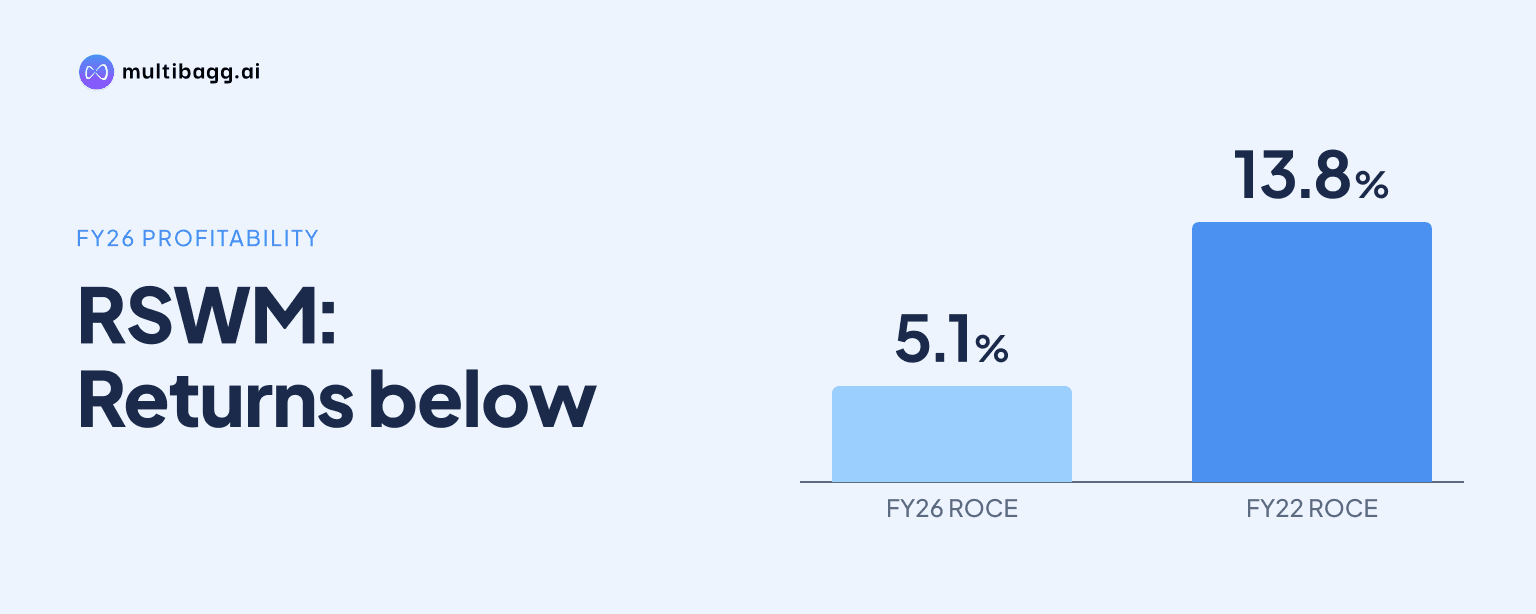
RSWM Limited returned to a Rs 52 crore profit after tax in FY26 from a Rs 41 crore loss in FY25, while return on capital employed rose to 5.1% from 2.2% but remained below FY22’s 13.8%. FY26 revenue fell to Rs 4,554 crore from Rs 4,825 crore in FY25.
Know RSWM inside out
Results, valuation, peers and who's buying, in one view.
What changed in RSWM revenue and gross profit?
RSWM’s revenue declined by Rs 271 crore year on year to Rs 4,554 crore in FY26, after reaching Rs 4,825 crore in FY25. Total income also fell by Rs 250 crore to Rs 4,605 crore from Rs 4,855 crore, although FY26 revenue remained above the Rs 3,817 crore reported in FY22.
Gross profit increased despite the revenue decline, rising by Rs 24 crore to Rs 1,753 crore in FY26 from Rs 1,729 crore in FY25. Gross-profit margin rose to 38.1% from 35.6%, but remained below the 43.7% recorded in FY22, showing that the FY26 improvement did not fully restore the earlier margin level.
How did RSWM return to profit in FY26?
RSWM returned to profit because reported profit after tax, or PAT, moved from a Rs 41 crore loss in FY25 to a Rs 52 crore profit in FY26. The FY26 PAT margin was 1.1%, compared with a 6.2% margin on FY22 PAT of Rs 240 crore, leaving both the absolute profit and margin below FY22.
Earnings before interest, tax, depreciation and amortisation, or EBITDA, rose to Rs 327 crore in FY26 from Rs 233 crore in FY25, while its margin increased to 7.1% from 4.8%. Profit before depreciation and tax, or PBDT, increased to Rs 204 crore from Rs 98 crore, and its margin rose to 4.4% from 2.0%.
The FY26 earnings recovery remained incomplete against the five-year comparison. EBITDA was Rs 137 crore below the Rs 464 crore reported in FY22, while PBDT was Rs 193 crore below FY22’s Rs 397 crore; the presentation provides the reported values but does not identify the drivers of these changes.
What does RSWM’s cash-flow and working-capital record show?
RSWM reported net operational cash flow of Rs 428 crore in FY26, Rs 18 crore higher than Rs 410 crore in FY25 and more than double the Rs 210 crore reported in FY22. This followed negative net operational cash flow of Rs 72 crore in FY24, making FY25 and FY26 a substantial change from that year’s reported cash position.
Net working capital was Rs 254 crore in FY26, compared with Rs 248 crore in FY25 and Rs 421 crore in FY24. The FY26 amount was Rs 6 crore higher year on year, after net working capital fell by Rs 173 crore between FY24 and FY25; the presentation does not specify the operational reasons for those movements.
Net worth rose to Rs 1,372 crore in FY26 from Rs 1,308 crore in FY25 and Rs 999 crore in FY22. The Rs 64 crore FY26 increase in net worth occurred alongside Rs 52 crore of FY26 PAT, whereas FY22 PAT was Rs 240 crore.
Got a follow-up? Ask IRIS
How has RSWM’s debt and capital base changed?
RSWM reduced total debt to Rs 1,510 crore in FY26 from Rs 1,622 crore in FY25 and Rs 1,777 crore in FY24. The FY26 figure was Rs 267 crore below the FY24 peak, but it remained Rs 407 crore above the Rs 1,103 crore reported in FY22.
Capital employed declined to Rs 3,468 crore in FY26 from Rs 3,525 crore in FY25 and Rs 3,593 crore in FY24. It was nevertheless Rs 931 crore higher than FY22’s Rs 2,537 crore, while FY26 EBITDA of Rs 327 crore and PAT of Rs 52 crore remained below their respective FY22 amounts.
From FY24 to FY26, debt fell by Rs 267 crore and capital employed decreased by Rs 125 crore. The historical data do not disclose a debt target, refinancing plan or a stated allocation for FY26 net operational cash flow of Rs 428 crore.
Why are RSWM’s FY26 return ratios still below FY22?
RSWM’s return on capital employed, or ROCE, recovered to 5.1% in FY26 from 2.2% in FY25, but was 8.7 percentage points below FY22’s 13.8%. Return on equity, or ROE, turned positive at 3.8% after negative 3.2% in FY25, yet remained below FY22’s 24.0%.
The positive FY26 ROE coincided with the move to Rs 52 crore of PAT from the FY25 loss of Rs 41 crore. However, FY26 net worth was Rs 1,372 crore, compared with Rs 999 crore in FY22, while PAT was Rs 188 crore lower than FY22’s Rs 240 crore.
Fixed-asset turnover was 3.1 times in FY26, compared with 3.2 times in FY25 and 3.8 times in FY22. The FY26 ratio was above FY24’s 2.9 times, but the presentation’s historical record shows that revenue of Rs 4,554 crore did not match FY25’s Rs 4,825 crore and turnover did not return to FY22’s level.
Conclusion
RSWM’s FY26 figures show a recovery in profitability, cash generation and reported return ratios after FY25. PAT improved by Rs 93 crore from a Rs 41 crore loss to Rs 52 crore of profit, net operational cash flow reached Rs 428 crore and ROCE rose to 5.1%, but EBITDA, PAT, ROCE, ROE and fixed-asset turnover remained below FY22 levels.
The next issue is whether RSWM can extend the FY26 improvement in margin and cash generation into higher capital efficiency. The presentation is labelled Q2 and H1 FY27, but its historical pages disclose no FY27 financial target, debt target or capital-employed target; changes from FY26 debt of Rs 1,510 crore, capital employed of Rs 3,468 crore and ROCE of 5.1% remain the disclosed matters to watch next.